PC221 Analog Electronics I
RC Circuits
Objectives
- To examine capacitor charging and discharging
- To examine frequency response of an RC circuit
- To introduce measurement of phase in AC circuits
- To expand the use of SPICE circuit simulation to
include AC analysis.
- To compare results of analysis, measurement, and simulation.
Equipment
- digital multimeter, bench power, oscilloscope
- various resistors and capacitors
Background
One of the common problems in electronics is filtering out
unwanted
signals from a waveform. One example of the need for this is to
remove noise (such as 60Hz noise) from a signal. DC power supplies
almost always have some 60Hz ripple (i.e. AC component) due to
the AC frequency of our power. What you're going to do in this
lab is to use a simple filter to see how effectively it removes
noise. To do this you'll use a signal generator to produce
a DC signal with ripple, and then try to filter to voltage
being provided to a load (in this case, just a fixed resistor.)
To see how the filter works, you'll want to look at the voltages and
currents
over a range of frequencies.
AC circuits with inductors and capacitors
Once capacitors and inductors are included in circuits,
analyzing DC and AC parts of the behaviour becomes slightly more
complex.
For DC analysis,
- replace all capacitors by an open circuit (i.e. no
connection)
- replace all inductors by a short circuit (i.e. a
wire)
The AC analysis is more challenging since the impedance of
a capacitor or an inductor changes with frequency.
For AC analysis,
- replace all capacitors by the proper impedance
of ZC = j / (ω C)
- replace all inductors by the proper impedance
of ZL = j ω L
The math is the same, but it now involves complex quantities.
The real part of any voltage or current is what is actually
measured.
Procedure
Setup
- Assemble the parts for the circuit shown, using the
components as
follows:
V is a 1V AC sine wave source (of varying frequency)
with a DC offset of 5V, like this:
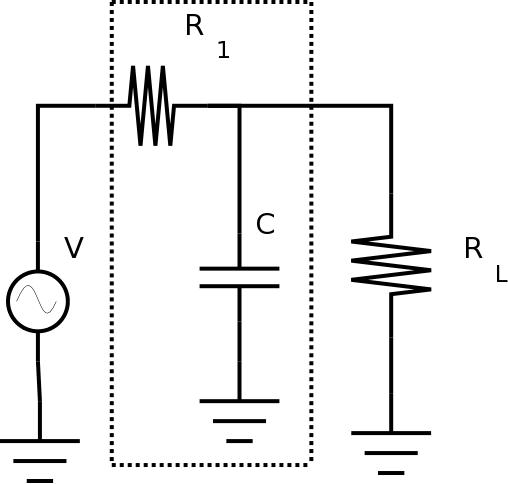
The other values are;
- R1 = 100 Ω
- RL = 1.0 kΩ
- C = 1 μF
Circuit Measurement: Digital Multimeter
- Measure the component values with a digital
multimeter, and fill them in Table 1.
Here's a link on
measuring capacitance.
| Table 1: Component Values and Voltages |
| Quantity |
Measured Value |
Units |
| R1 |
|
|
| RL |
|
|
| C |
|
|
| V (amplitude) |
|
|
| V (offset) |
|
|
Circuit Measurement: Oscilloscope
- Connect the function generator to the oscilloscope.
Make sure the scope channel is in DC mode for
this.
Adjust the wave generator to produce a 1V 100Hz sine wave, with a
DC offset of 5V.
When using a wave generator, always check the
output with a scope before connecting it to a circuit.
Then when you connect it to the circuit, if it changes
drastically, there is probably something wrong so you can
disconnect it and examine the circuit.
- Measure DC and AC supply voltage(s) with an oscilloscope,
(amplitude and offset), and fill them in Table 1.
Circuit Measurement: Choice of Instrument
- Once the function generator is set up correctly, measure the
DC and AC components of the voltage across
RL at frequencies of 100Hz, 300Hz, 1kHz, 3 kHz and so
on up to 100 kHz using whatever instrument you feel appropriate.
This is one time when the use of
AC coupling on the oscilloscope may be useful.
When you have a signal with an AC component that is much smaller
than the DC component, switching to AC coupling will allow you
to expand the scale for the AC component. Switching back to DC
coupling will make it possible to change the scale to measure the
DC component.
-
Sketch the waveform at 100Hz, 1kHz and 10kHz.
Show your sketches and your results to the lab
instructor before continuing.
- Plot the AC amplitude gain in decibels versus the log of the
frequency. This is called a
Bode plot.
Circuit Visualization: Frequency Sweeps
Many function generators can perform a sweep of frequencies
for observing the response of circuits like this. While a varying
frequency isn't helpful for taking measurements, it allows you to
observe circuit response quickly.
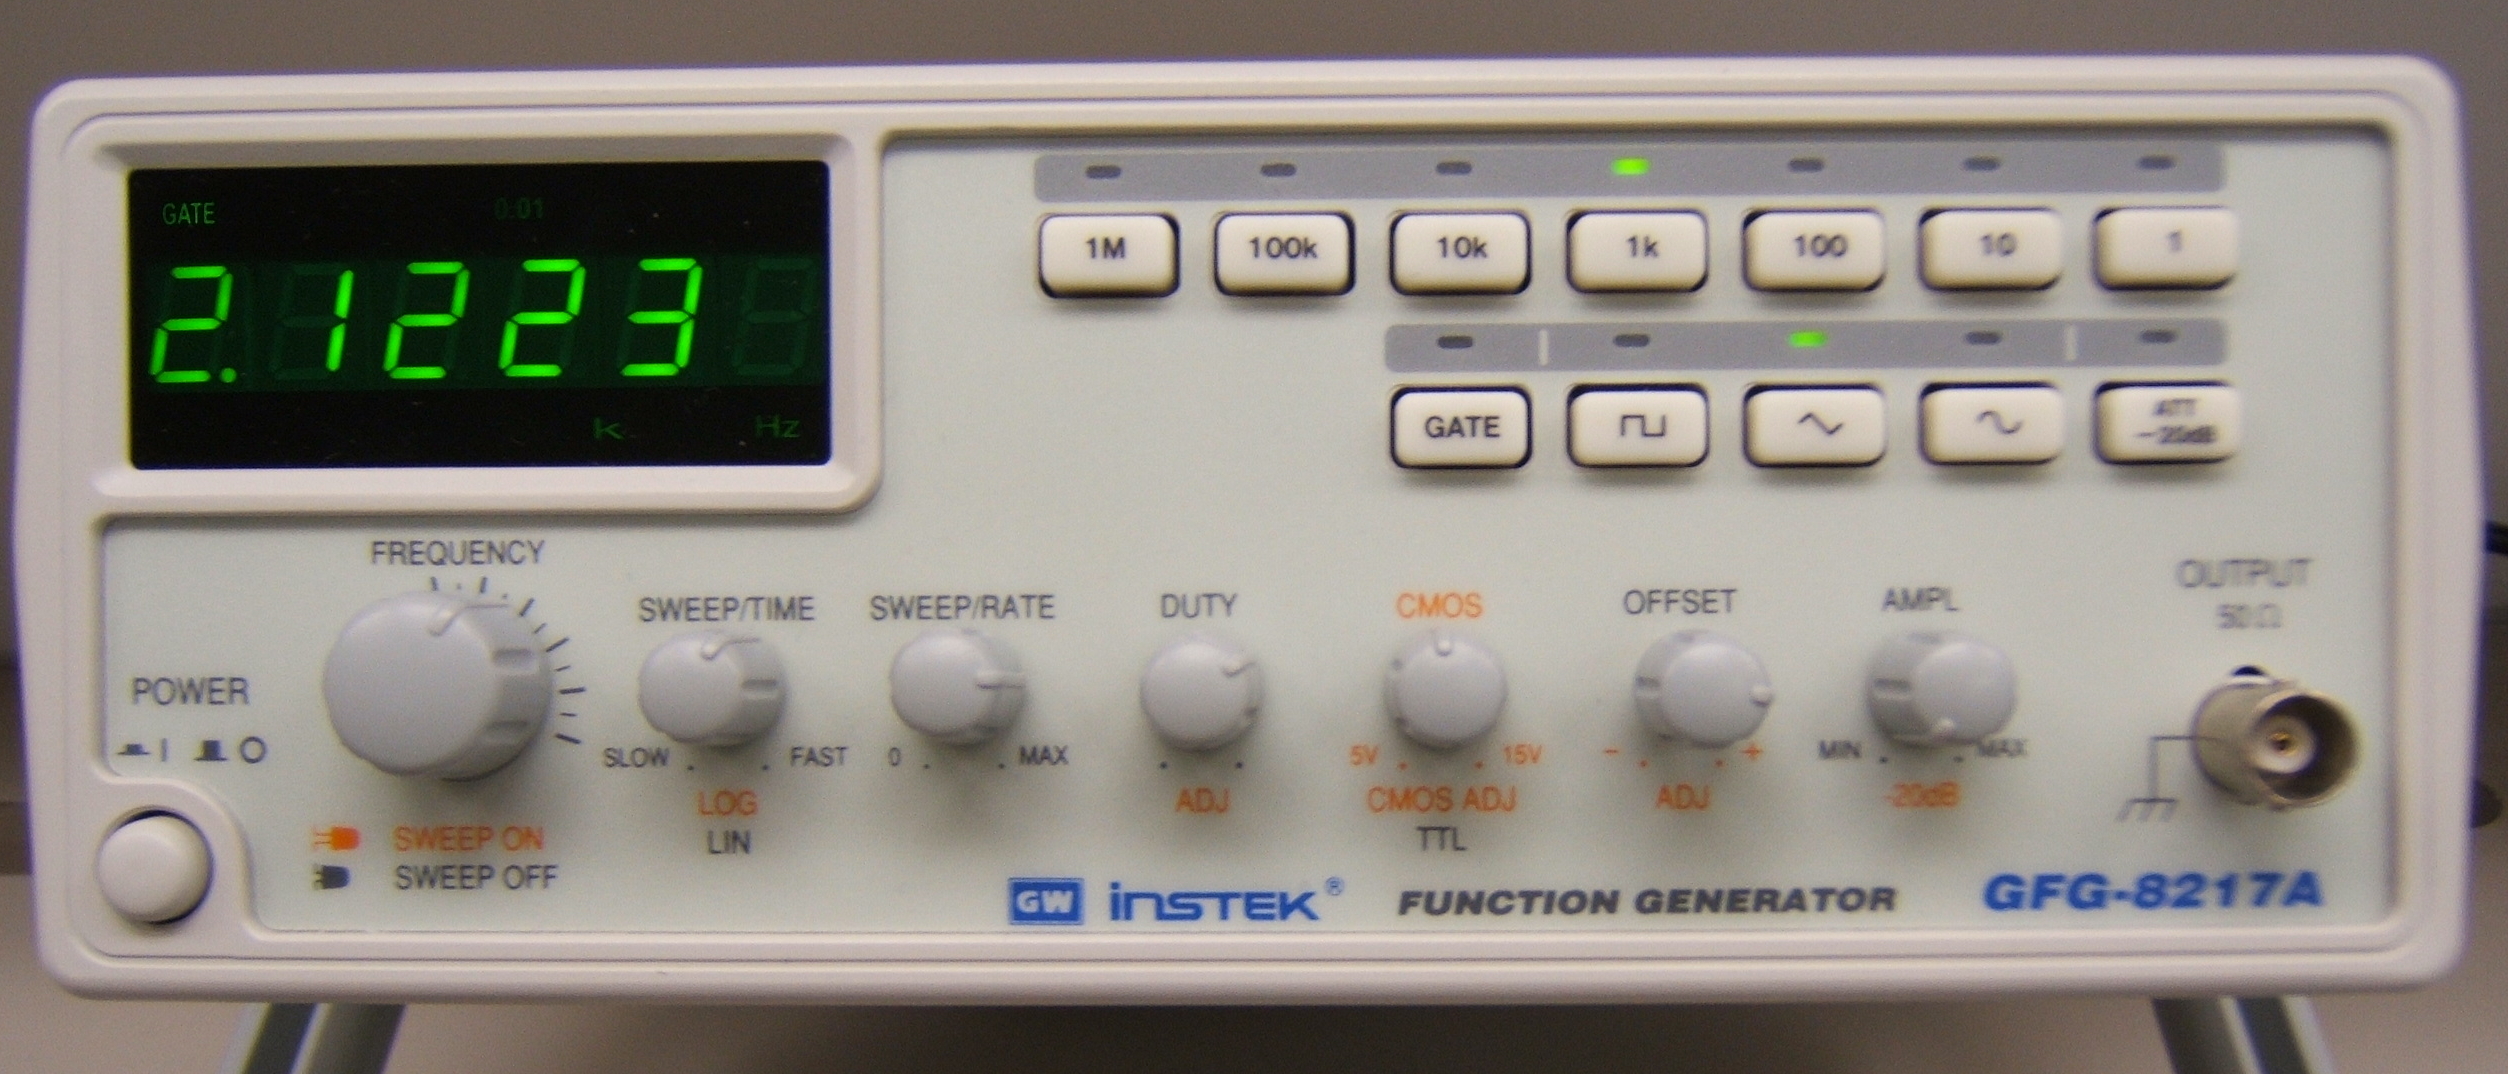
Three controls are used for a sweep:
- frequency
- sweep/time
- sweep/rate
When the frequency control is pulled out, the
frequency sweeps, rather than staying constant.
The sweep/time control determines the speed of the
sweep, and whether it is pulled out determines whether the sweep is
linear or logarithmic. (The logarithmic sweep is more useful when
the range is very large.)
The sweep/rate control determines the range of
frequencies to sweep; it goes from zero (i.e. DC) to some percentage
of the frequency chosen by the frequency dial. (Max allows
it to sweep all the way up to the set frequency.)
- Set the dial for a frequency of 100 kHz, and adjust the
settings to make a sweep over this range.
- With the oscilloscope connected to show the voltage across
RL, run the sweep and observe the result.
Is this a useful feature? Would it be worth using before taking
measurements?
Show your sweep to the lab
instructor before continuing.
Circuit Simulation: Introducing AC analysis
- SPICE can do many different types of
circuit analysis.
Use LTspice or CircuitLab to perform an analysis to
observe the DC behaviour of the circuit.
(Hint: You've previously
used an analysis that gives the DC behavior of a circuit.)
Be sure to use the component values and supply voltage(s)
from Table 1.
-
Perform whatever analysis you need to create traces to compare
to the sketches you produced above. (Hint: You've previously
used an analysis that shows what waveforms look like over
time.)
-
If using LTspice:
Use the information in the
LTspice
tutorial
to do an AC
analysis.
If using CircuitLab:
Do a frequency domain analysis.
-
This analysis shows the ac amplitude over a range
of frequencies. Note that this is different from a transient
analysis.
Use at least 10 points per decade in your simulation.
Your trace will show both amplitude and phase. Figure out how
to determine which is which, and how to show each one
separately.
In order to make it easy to compare your
trace to your Bode plot from measurements, change the vertical
scale from "dB" to "logarithmic".
Analysis: Kirchhoff's Laws
You can complete the rest of this
after
you have left the lab. If your results so far are consistent,
doing the analysis should be straightforward.
- Redraw the circuit in both ways (for DC and AC
analysis).
- Analyze the circuits in the two sketches to determine the
voltage across
RL in each case.
Be sure to use the component values and supply voltage(s)
from Table 1.
(Note: You don't need to determine the voltages across the
other passive components.)
Remember that for the AC analysis, the resulting voltages and
currents will be AC quantities.
To see how the filter works, you'll want to look at the AC and DC
components across
RL
over a range of frequencies.
Comparing Results
- Compare the values from the actual circuit to the values from
your analysis and measurements above. Particularly, compare your
Bode plot to your AC analysis.
- Save your circuit and your LTspice files for future use.
Before you leave the lab, have the lab instructor
sign your lab notebook immediately after your last entry.


