Pages created and updated by
Terry Sturtevant
Date Posted:
May 12, 2017
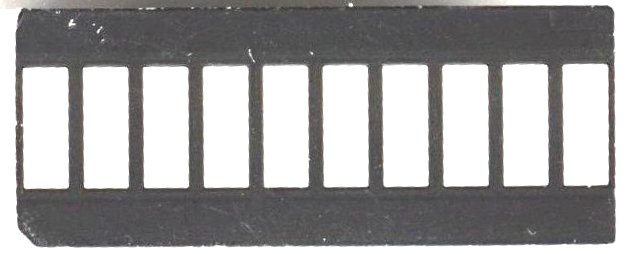
A bargraph LED is a collection of LEDs arranged side-by-side in a single device. It's a compact way to display several bits at once.
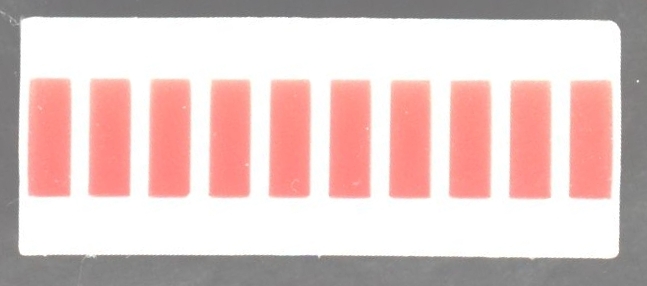
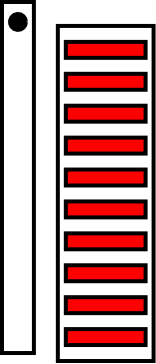
Here are two similar bargraph LEDs:
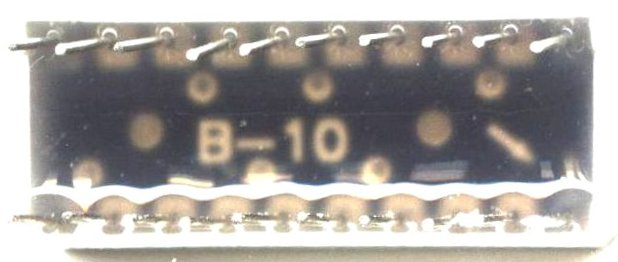
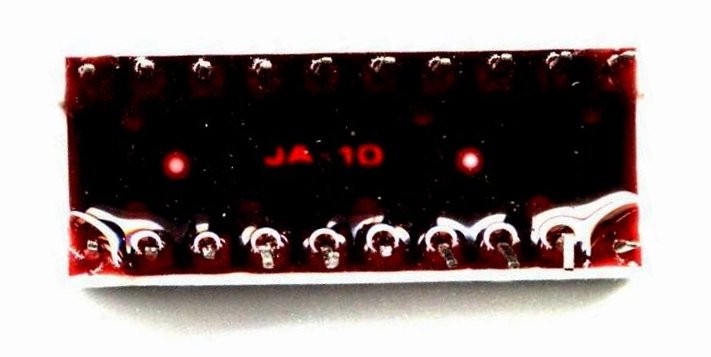
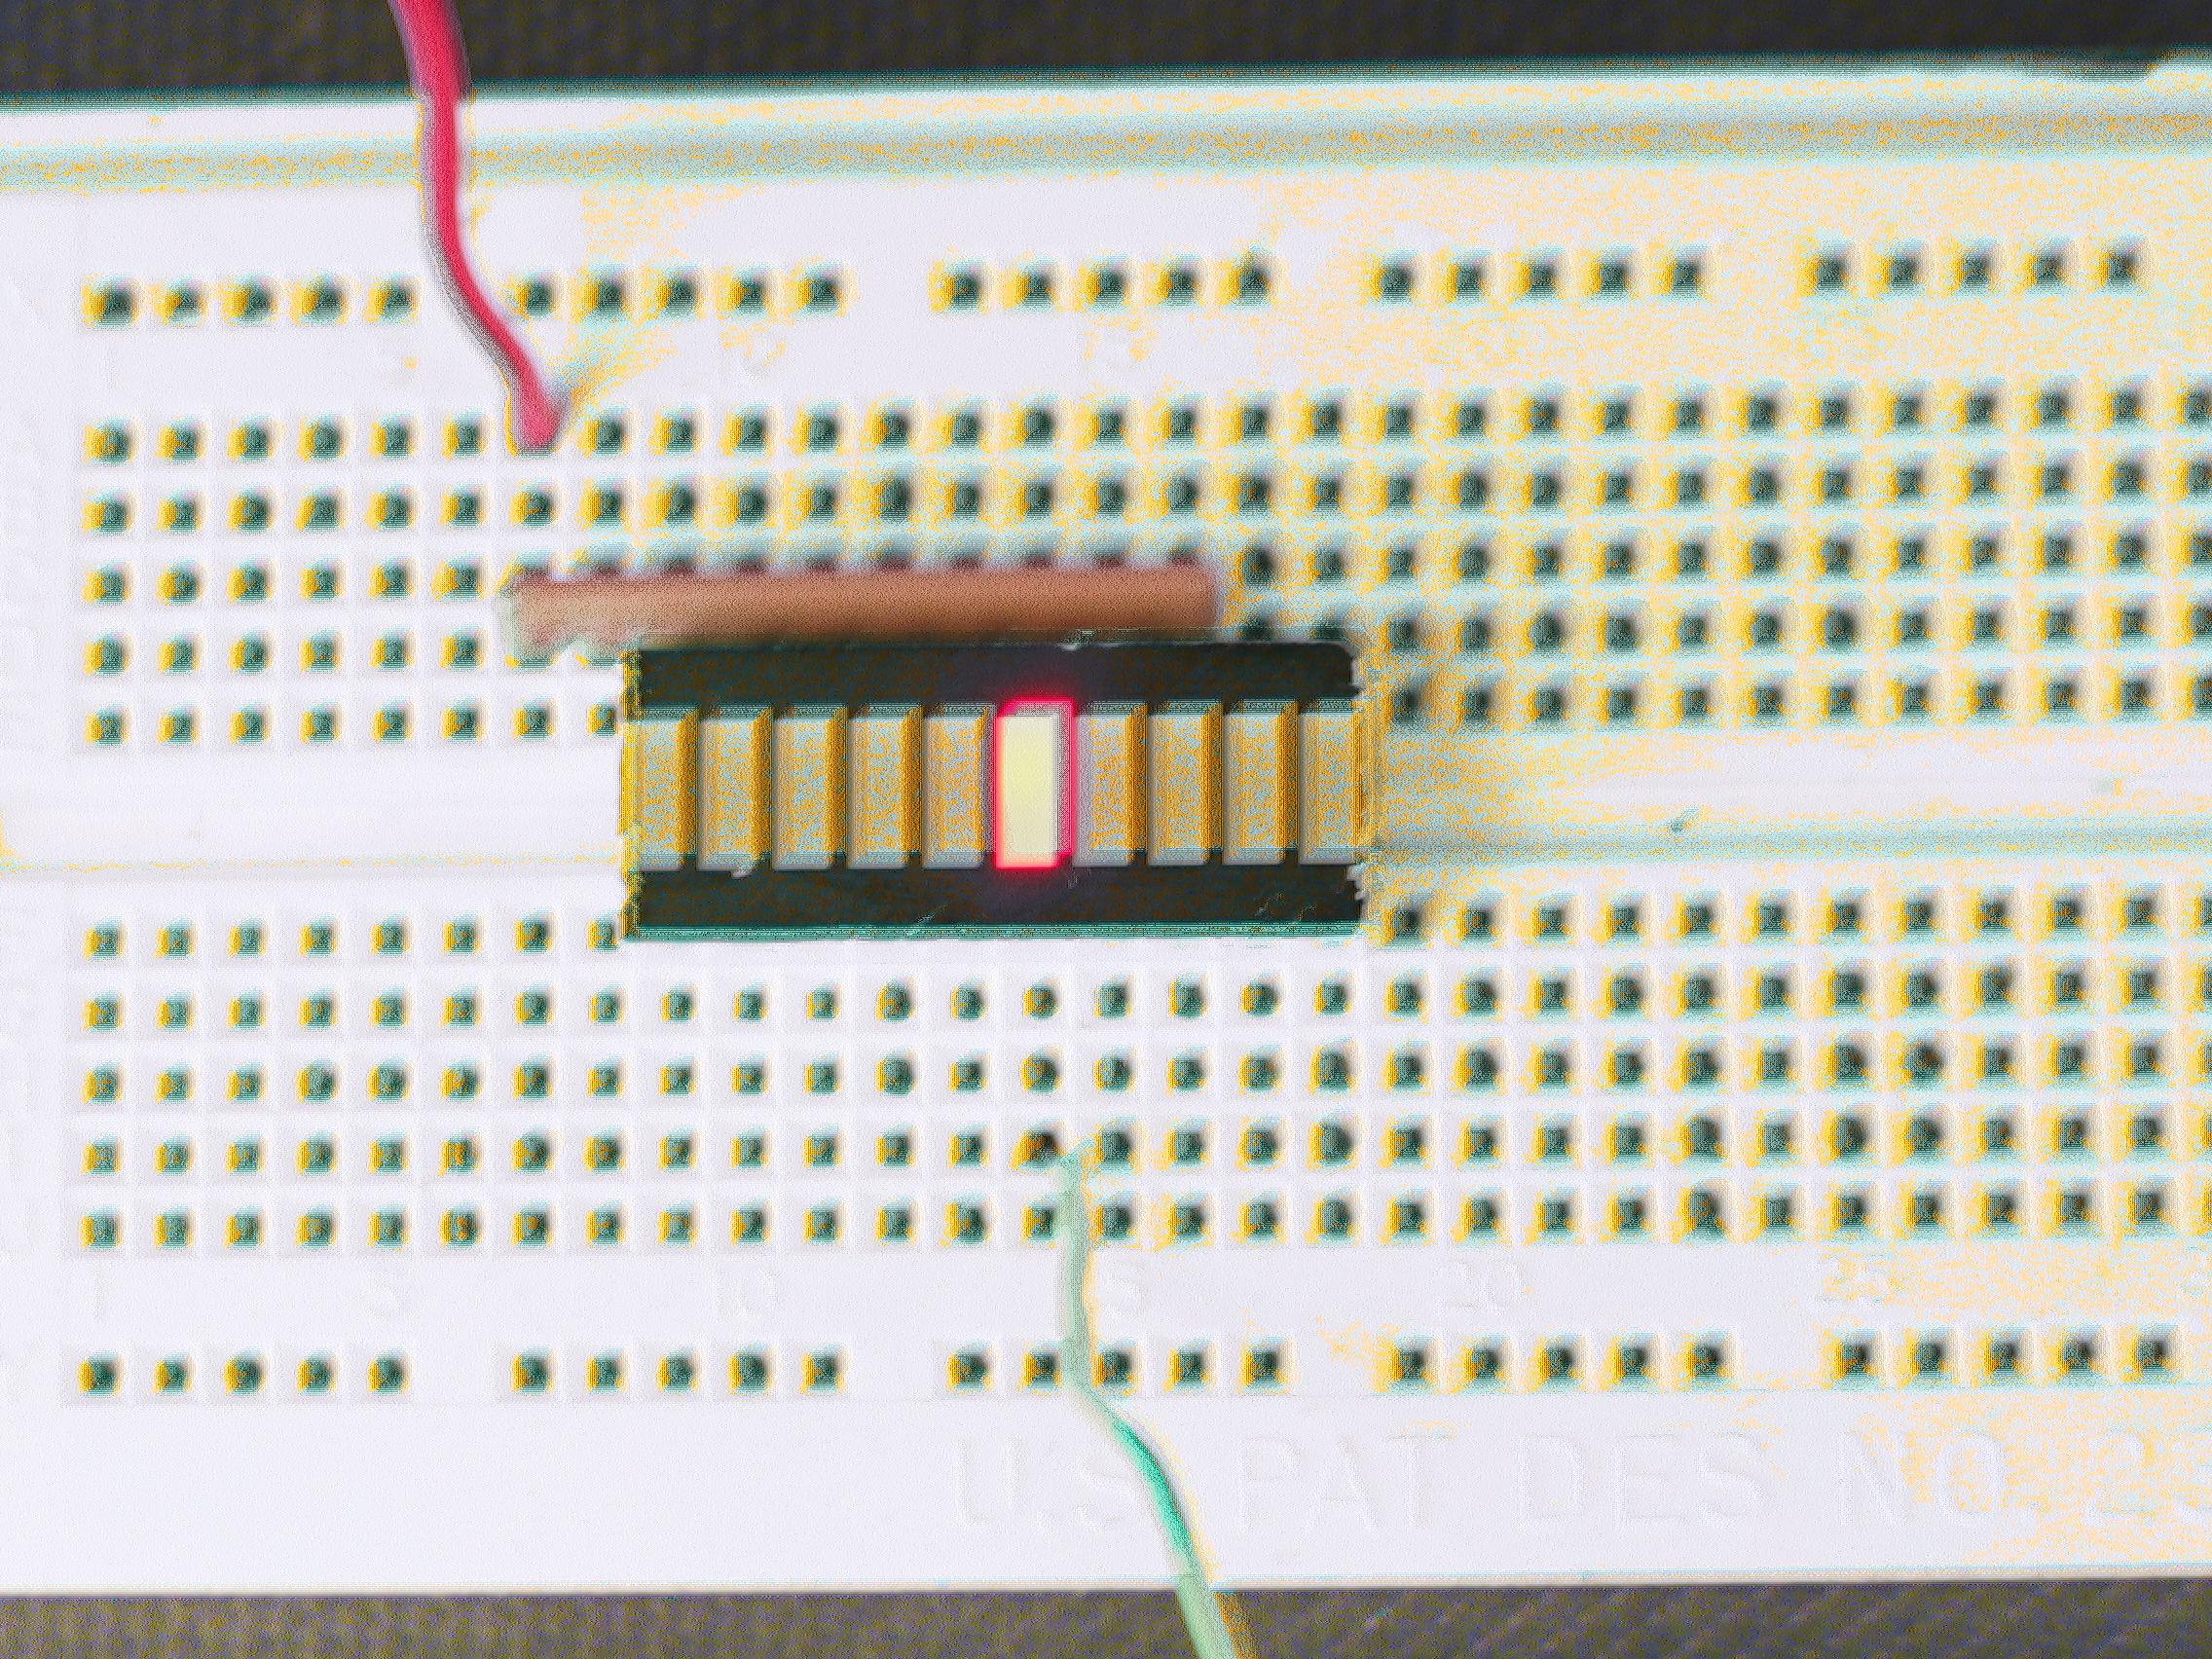
Here's what it looks like inside:
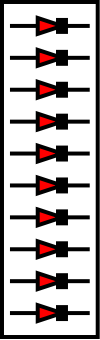
Each LED is connected to the obvious pins underneath. Remember that you will need to put a resistor in series with each LED to limit current. Remember also that the current will only light the LED in one direction. For many applications a resistor array might be a good choice for this.
As with any LEDs, each one needs to be used with a resistor to limit
current. This can be done by putting an individual resistor in series
with each one. However, since they're all in a row, it's much easier to
use a resistor array instead.
If the common pin of the resistor array is grounded, then a high on the
other side of any LED should light it up, provided the LED is the
right way around. If you're not sure which way the display should
go, just turn it around if it doesn't work one way.
If you want a LOW (0) signal to light up the LED,
simply reverse the common connection and turn the bargraph display around.
(You need to turn the bargraph around since current will need to flow
in the opposite direction.)
The actual resistor value isn't critical;
anything between about 100 Ω and 1 k Ω should work. With
smaller values, the LED will be brighter; with larger values, it will be
dimmer.
Ideally you want to choose a large value that makes the LED bright
enough to see clearly.
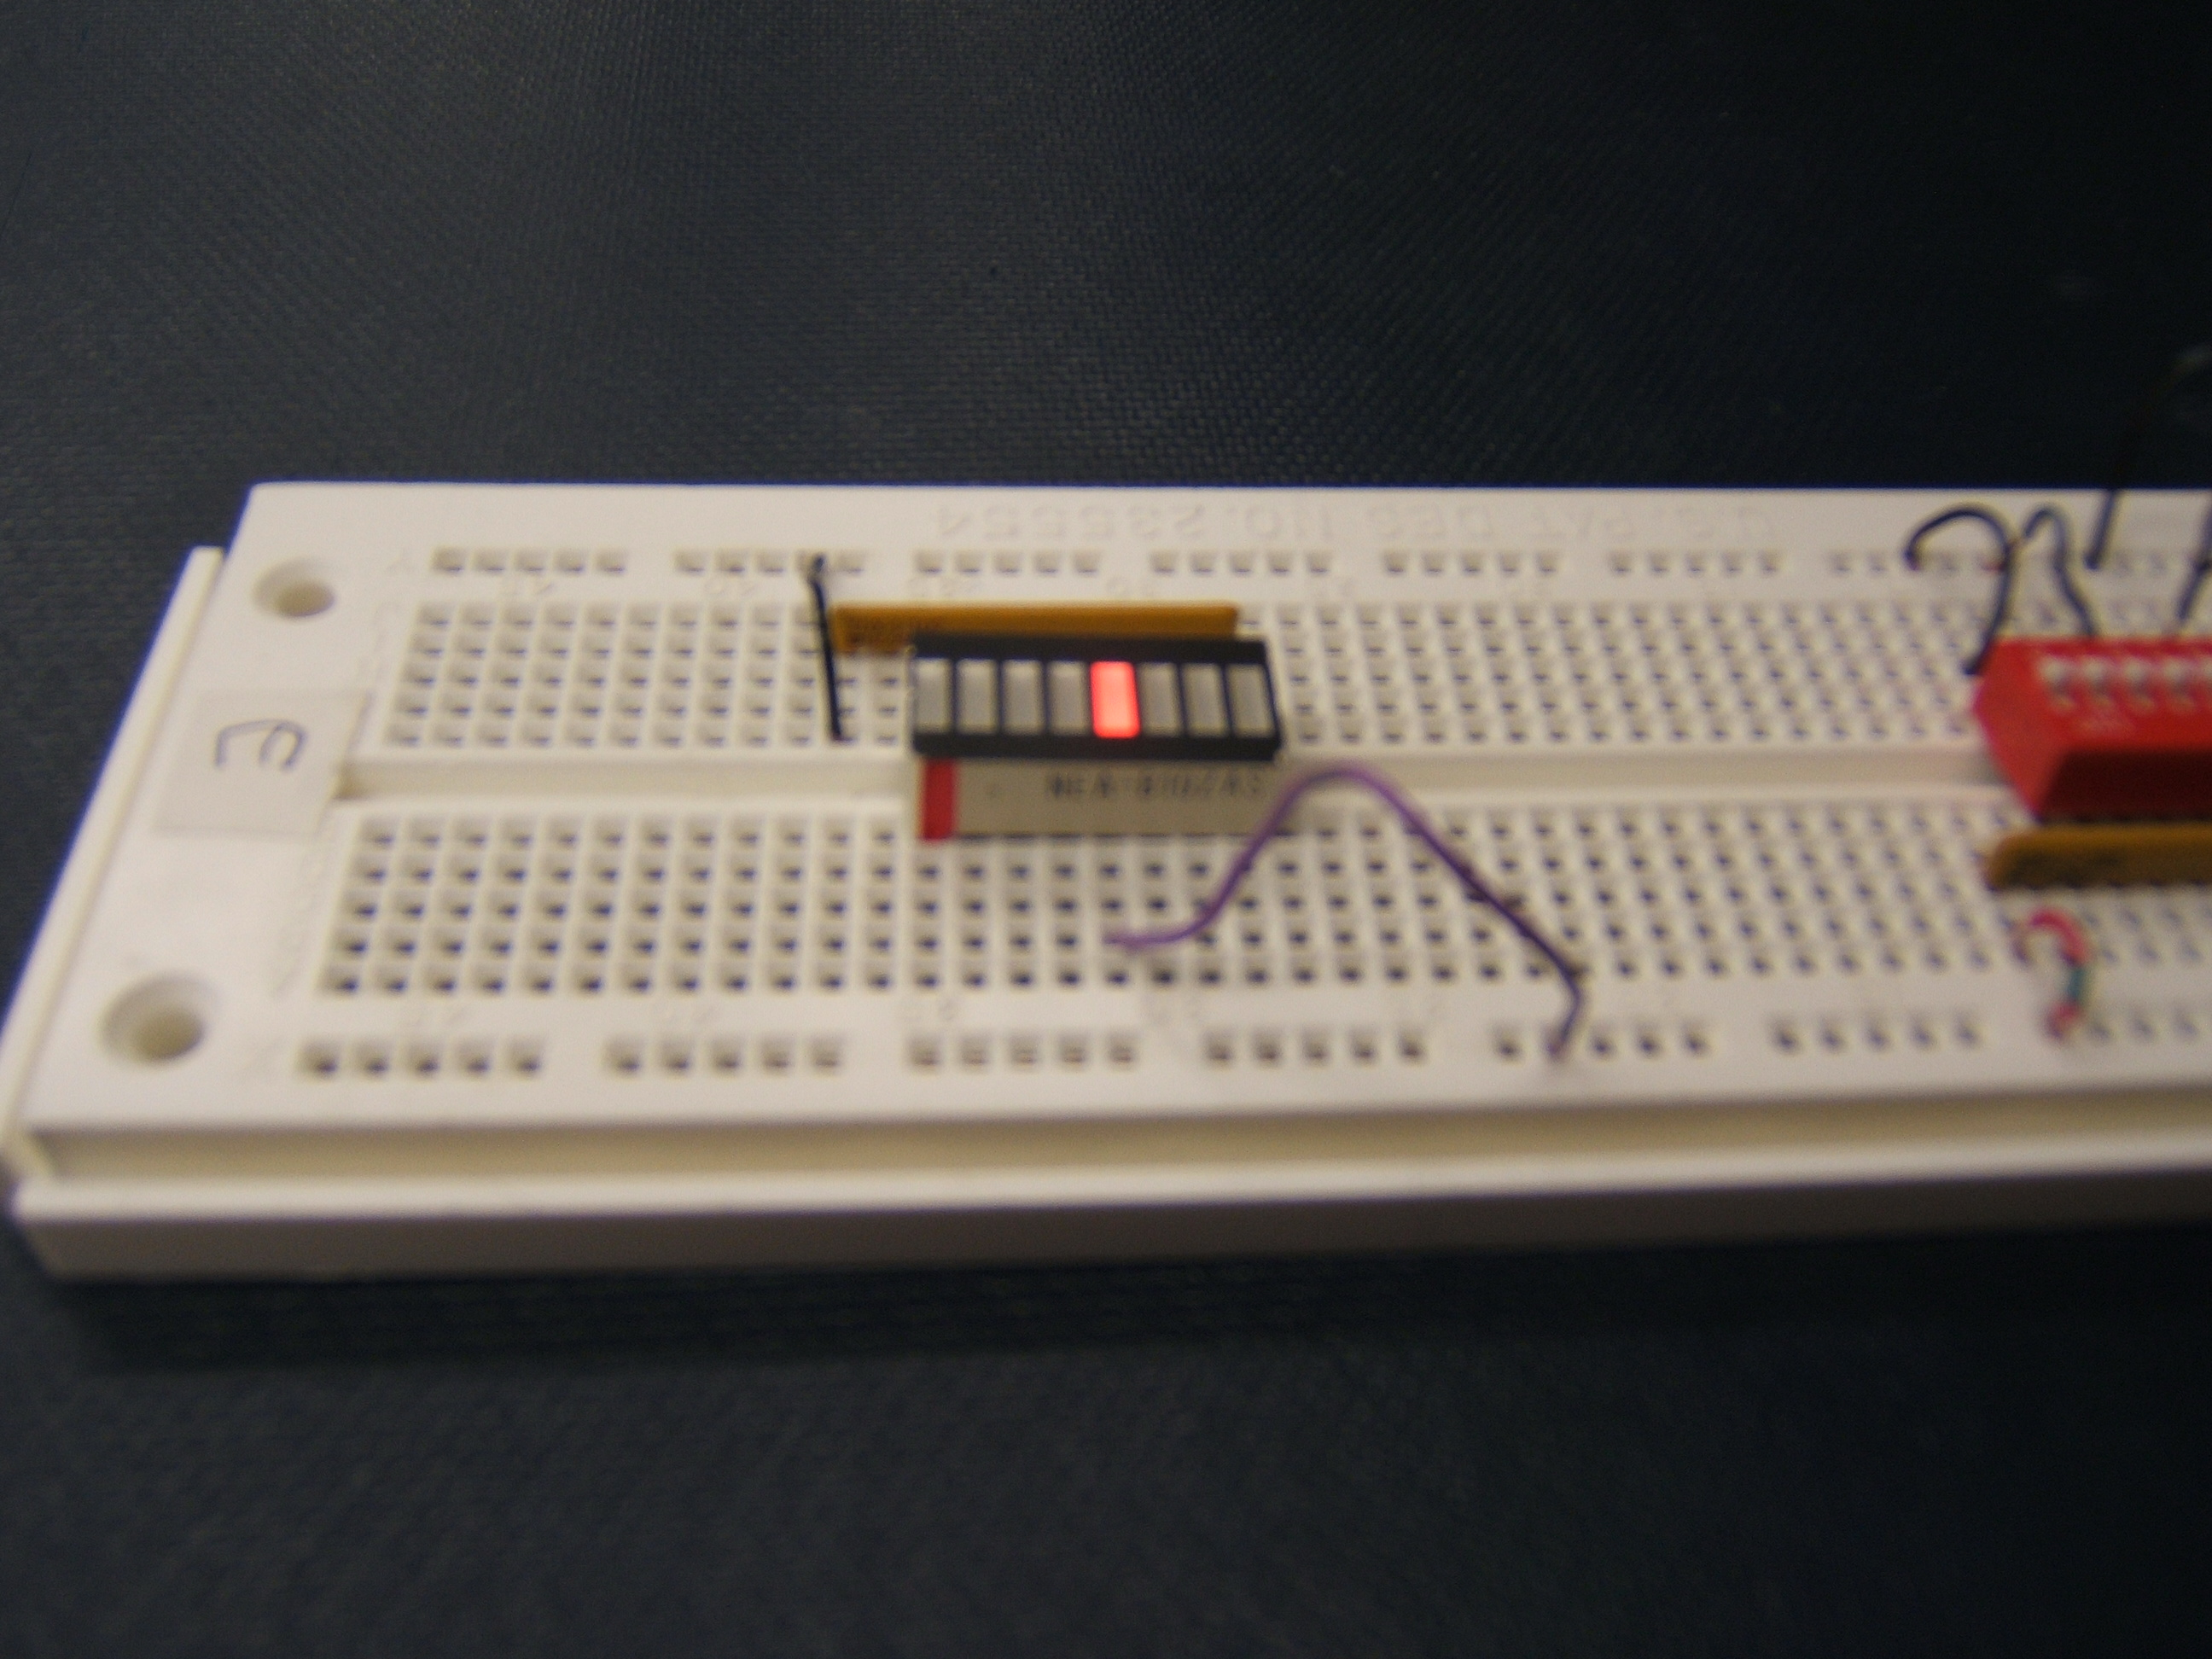
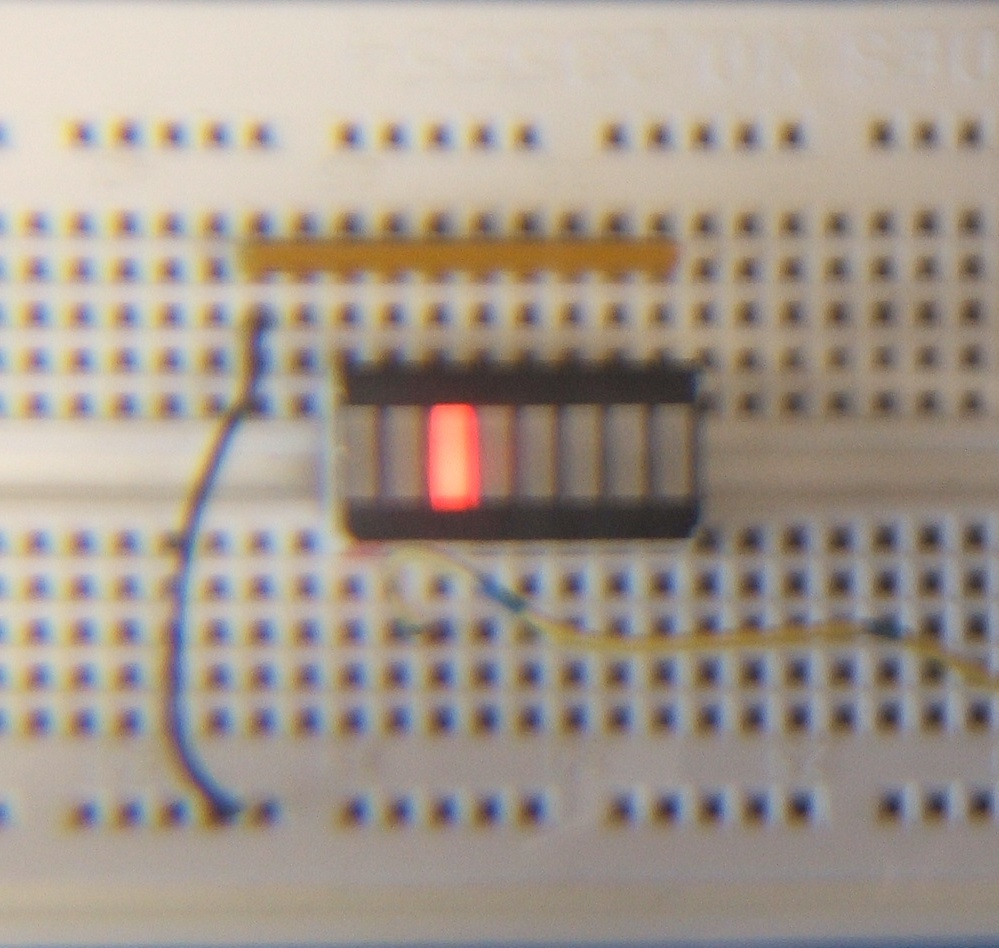
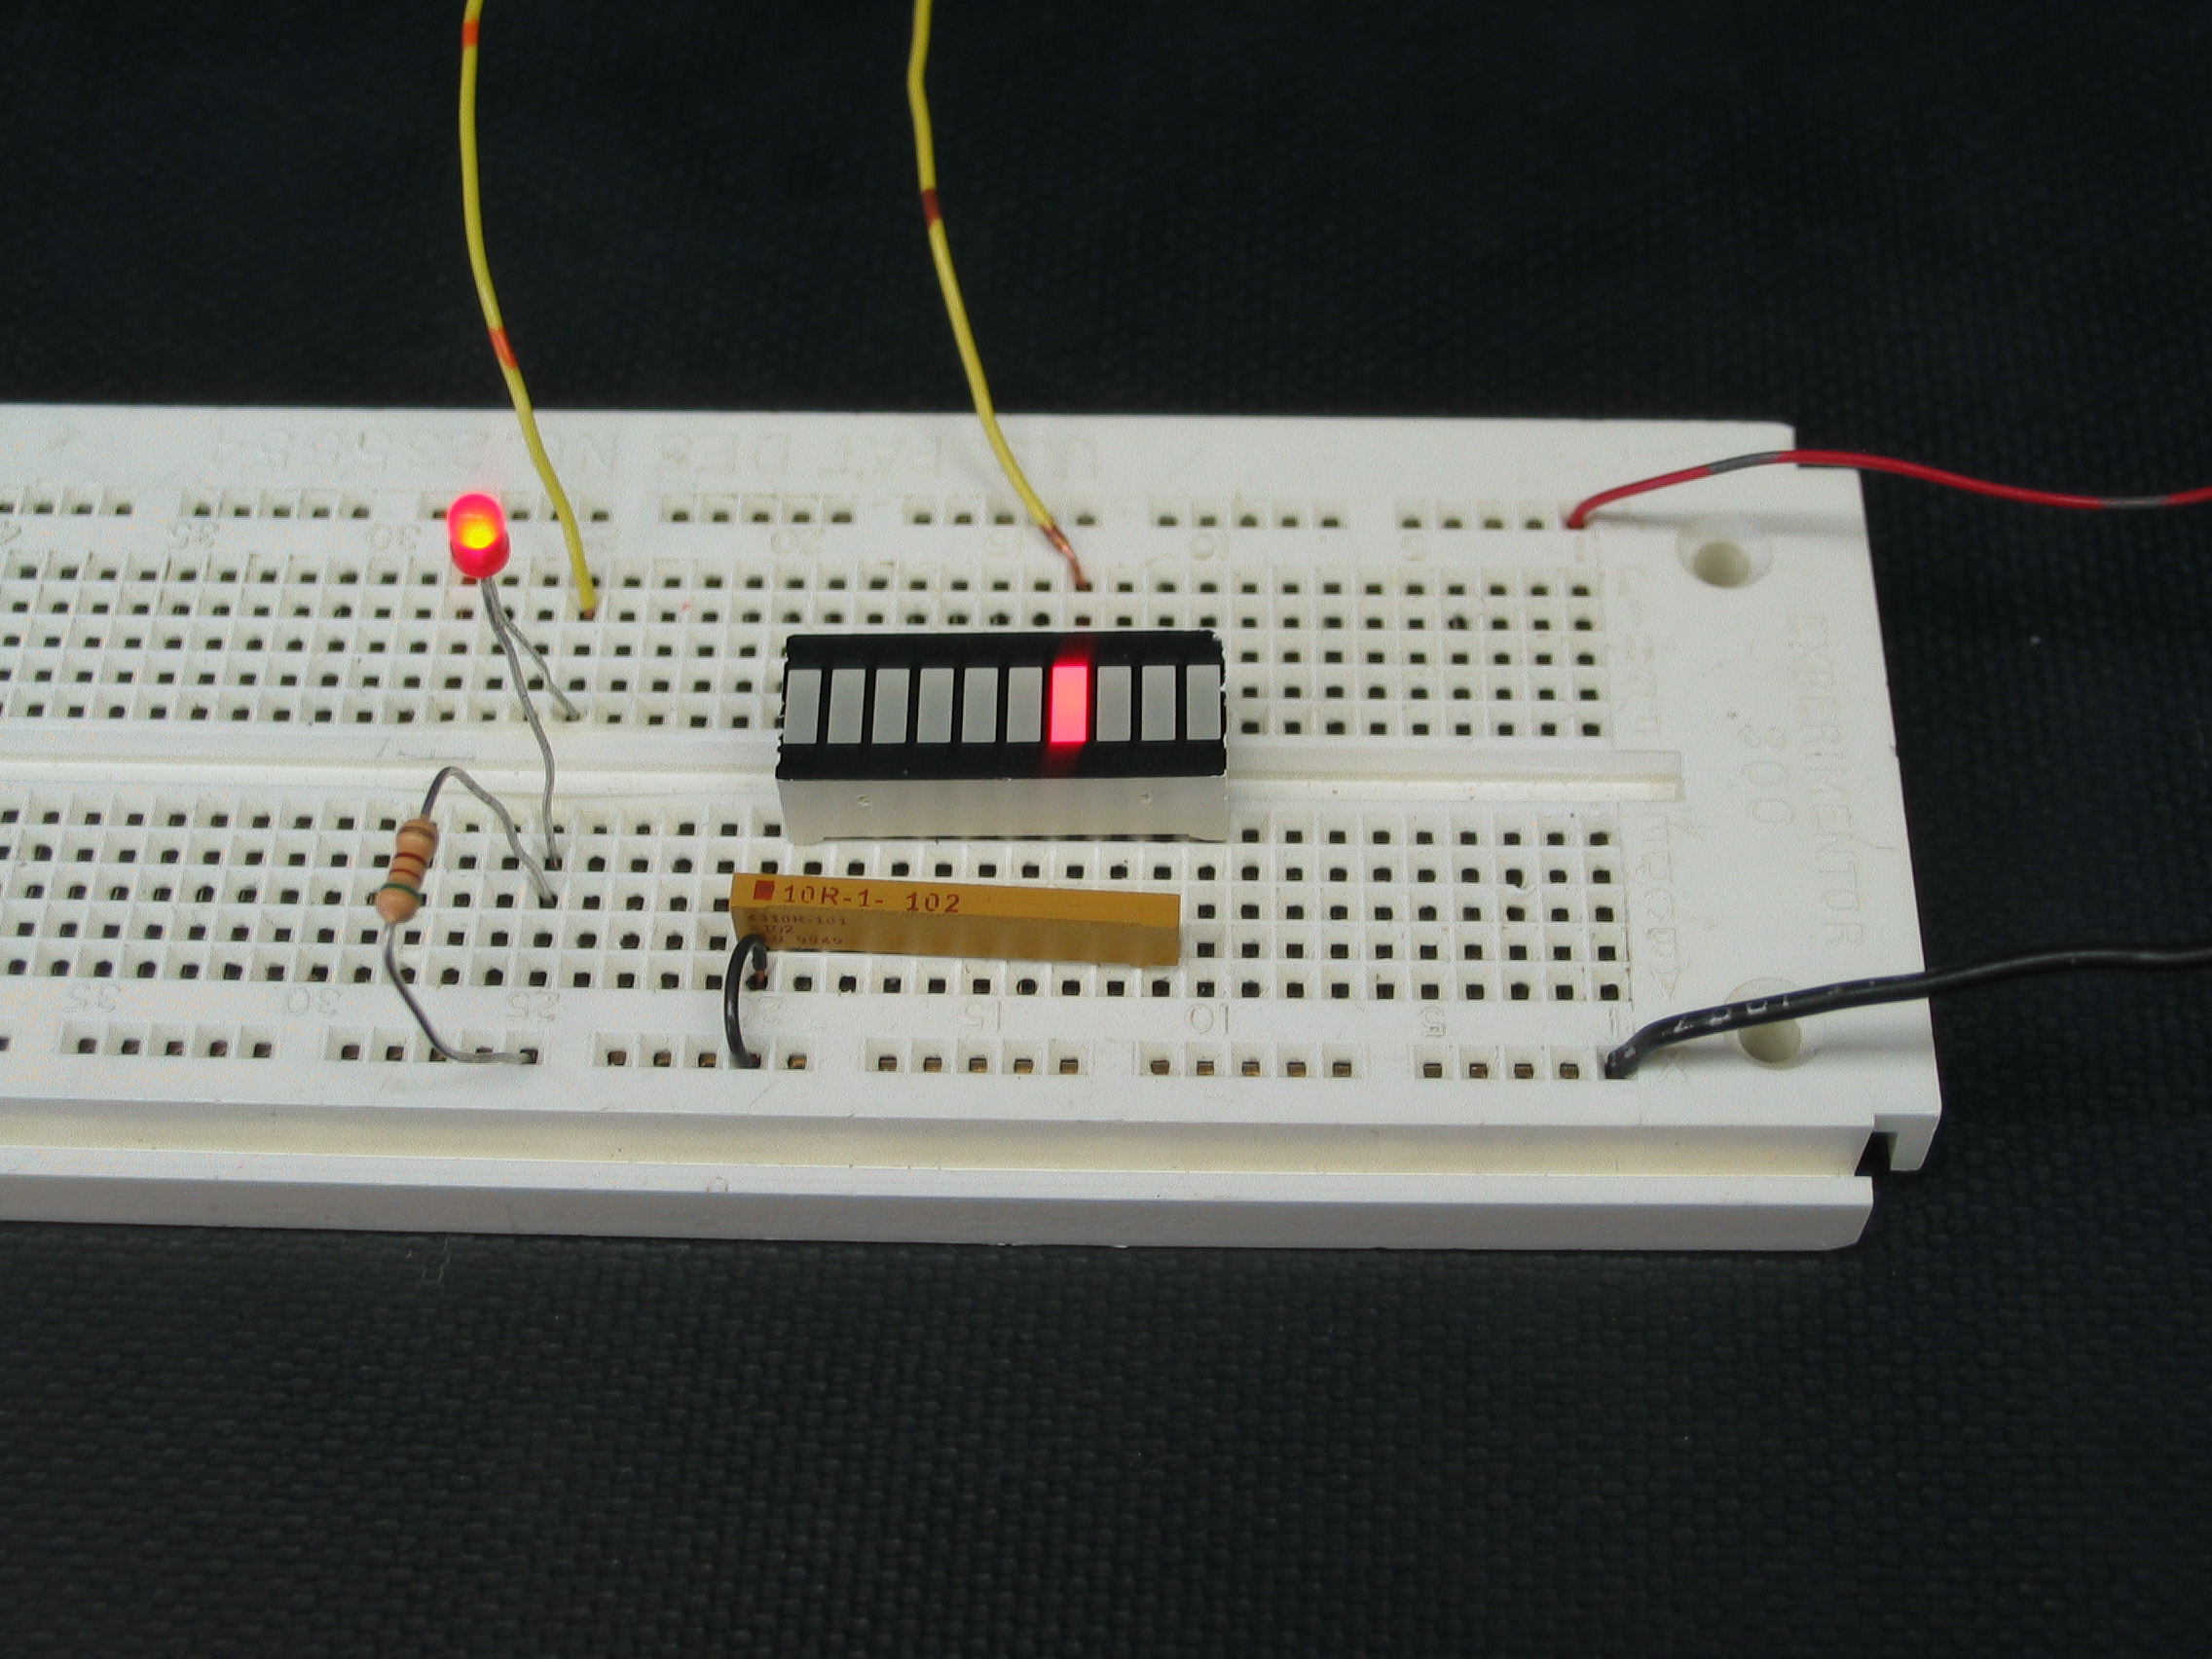
The image below shows how the connections are the same as for an
individual LED. (The signals come in on the yellow wires.)
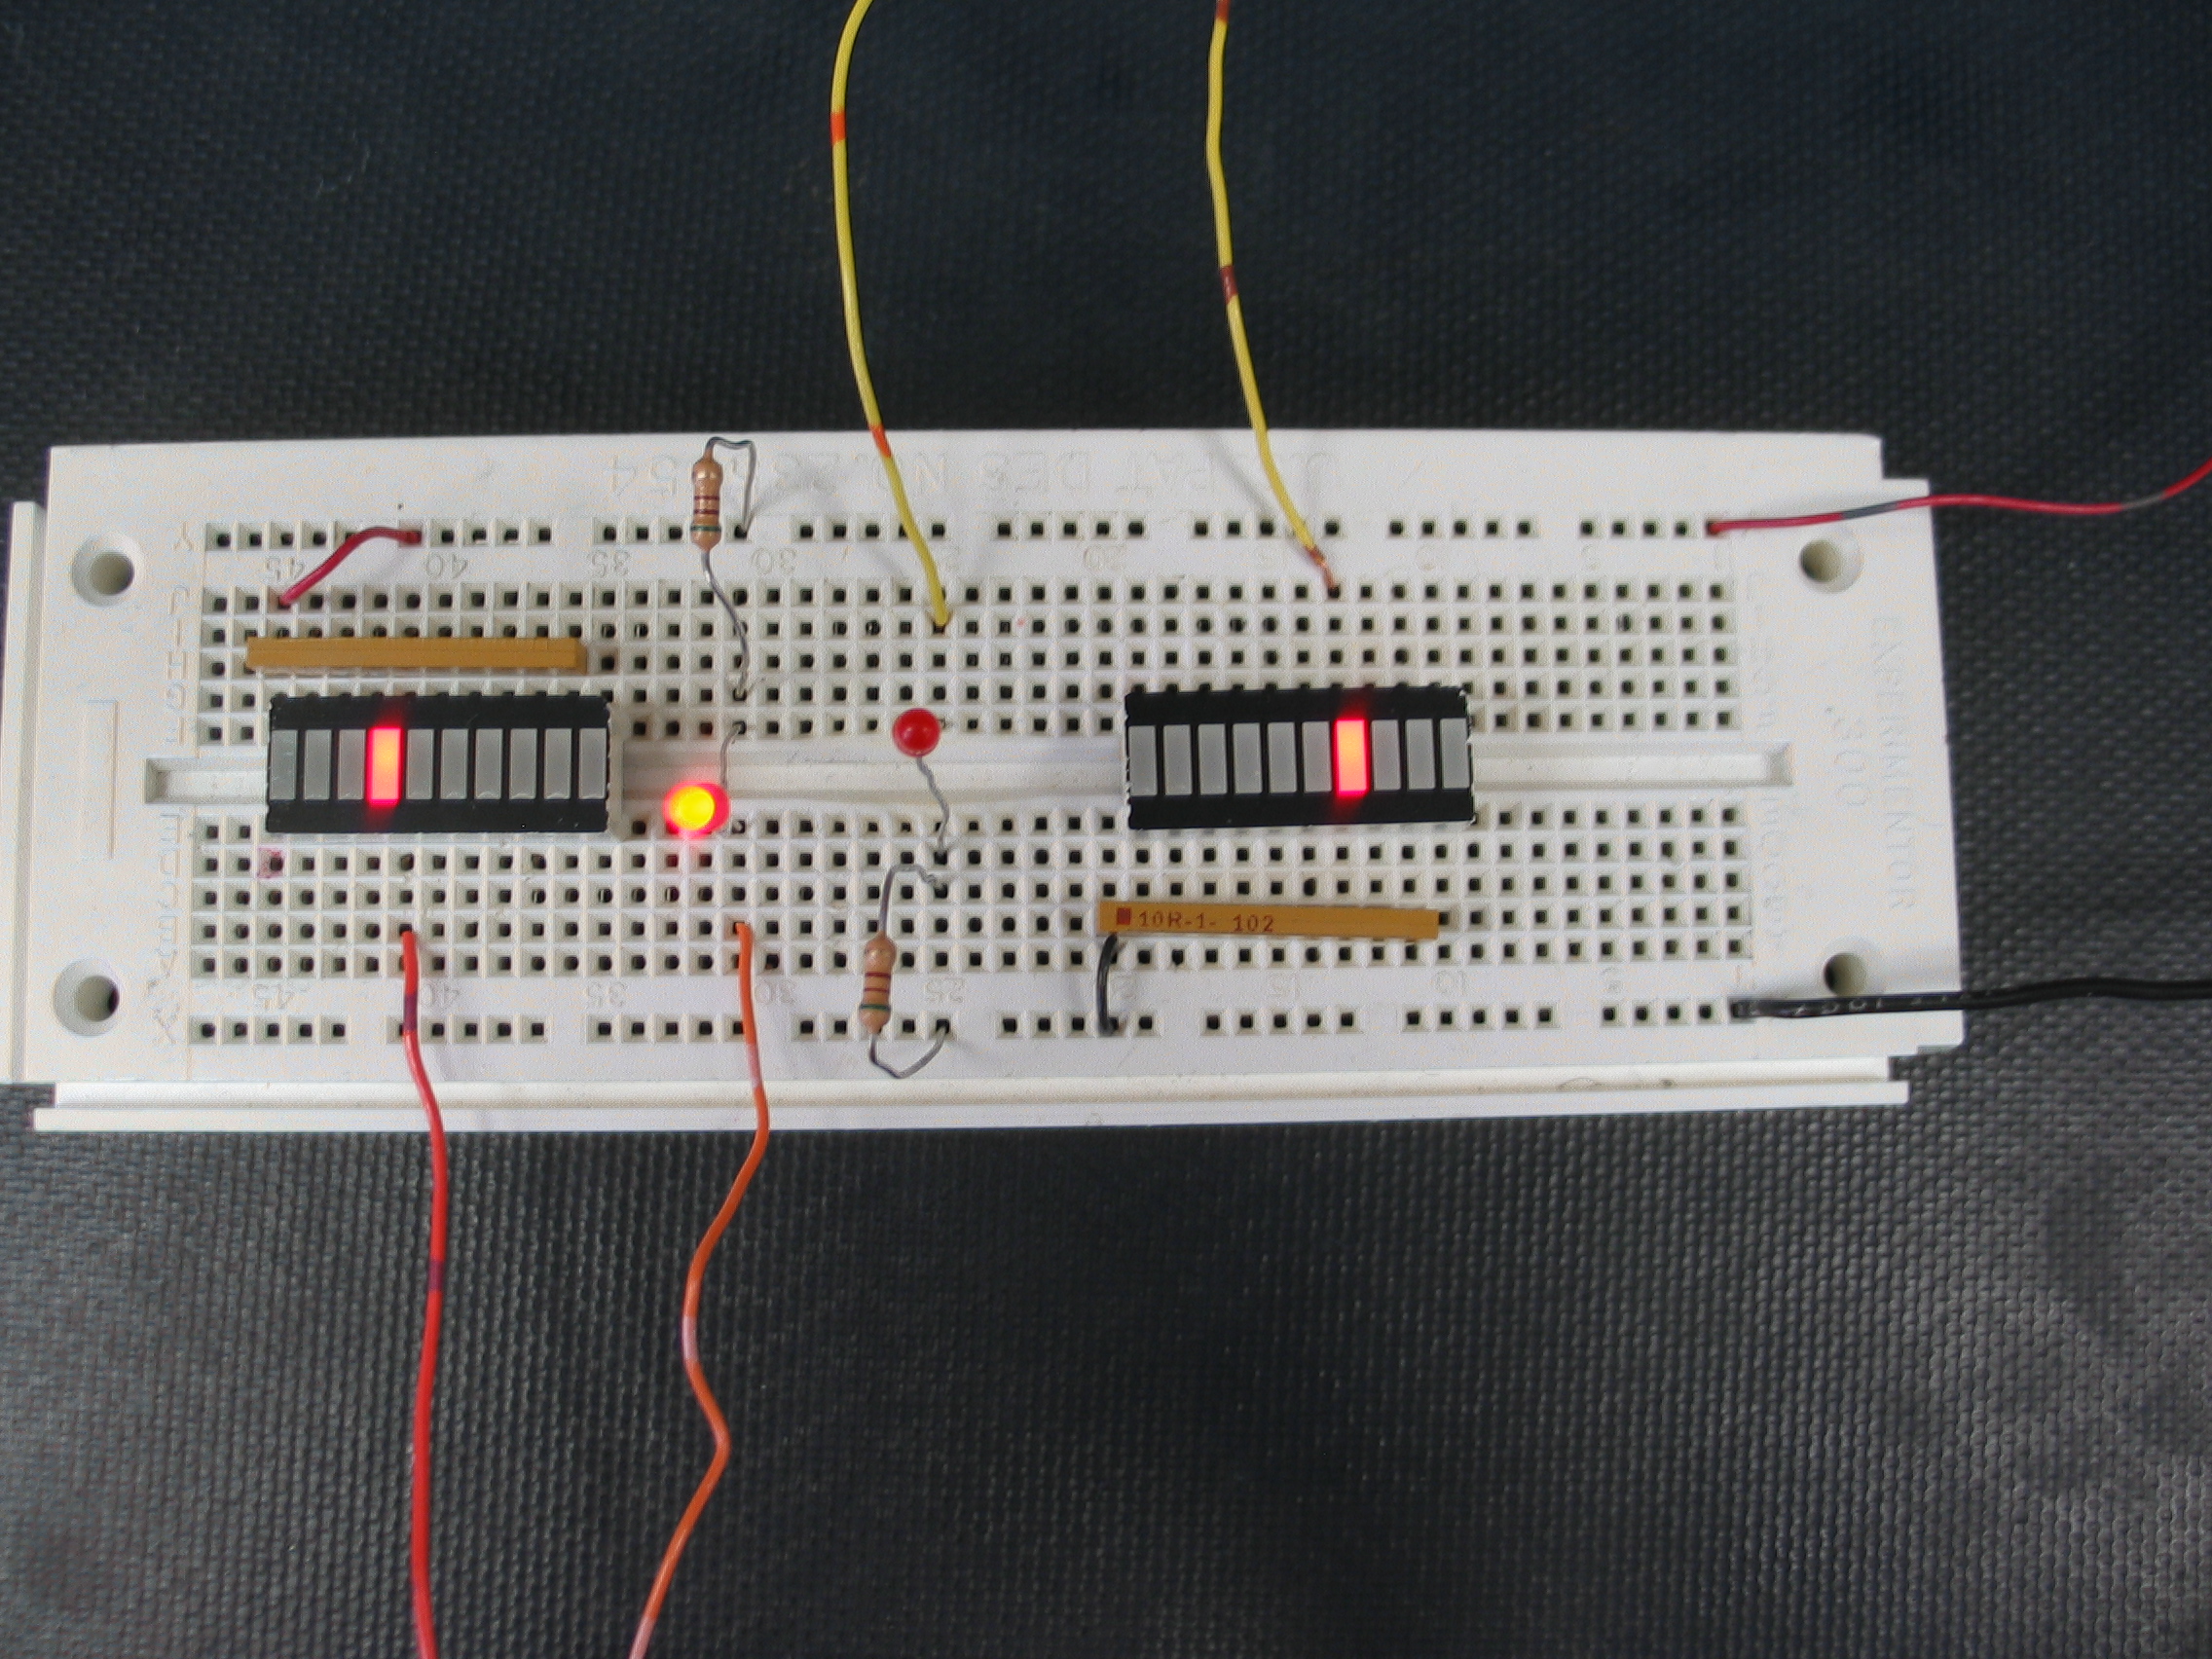
As wtih individual LEDs, they can be connected either active high or
active low. In the image below, the LED and bargraph on the right
are connected for active high signals, on the yellow
wires,
while the LED and bargraph on the left
are connected for active low signals, on the orange
wires.


![]()
Wilfrid Laurier University
© 2019 Wilfrid Laurier University