PC221 Analog Electronics I
Diodes and DC Sweeps
Objectives
- To introduce the use of variable DC supplies.
- To review the use of the function generator.
- To introduce plots of IV curves.
- To expand the use of SPICE circuit simulation to
include DC sweeps.
- To compare results of measurement, and
simulation.
Equipment
- digital multimeter, variable DC supply,
oscilloscope
- resistor and diode
Background
In this lab and the one that follows, you're not going to do
Kirchhoff's analysis of the circuits, and you aren't going to use
both the digital meter and the oscilloscope for all of the same
measurements. Instead, circuit measurements can use whatever
instrument is appropriate, and the comparisons will only be
between the measurements and the simulation values.
Often you want to plot I-V curves for devices for circuits.
IV curves in SPICE
There are at least a couple of ways to plot IV curves using
SPICE:
- Do a transient analysis, and plot voltage
versus current instead of versus time.
- Do a DC sweep of the voltage, and
plot voltage
versus current.
In order to show you how it's done, you'll use the latter method
in the lab. (DC sweeps can be done of many things, such as
temperature or resistance values; not just voltages.)
Procedure
Setup
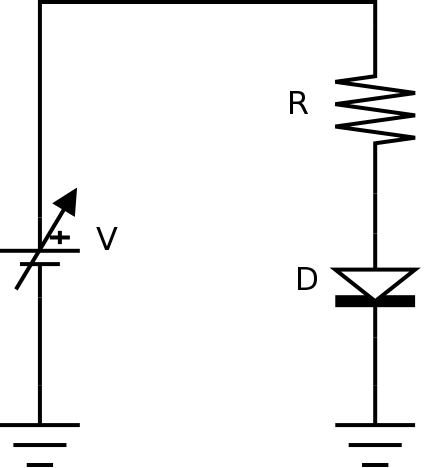
- Assemble the components for the following circuit:

The values are
- V = variable DC supply, from -10V
to +10V
- R = 1.0 kΩ
- D = 1N4004
Circuit Measurement: Digital Multimeter
-
Measure the resistance with the digital meter.
- Read Checking Diodes,
and test the diode in forward and reverse
directions. Could you tell which direction was forward biased by
measurements alone?
Demonstrate and explain diode checking to the
lab instructor.
- Build the circuit, and
determine the diode current and voltage over the range stated
above.
For the DC supply,
- to do negative voltages, reverse
the supply polarity
- use the digital meter to measure
the voltage across R
- use the digital meter to measure
the voltage across D
-
use the resistor voltage to
determine the
current through R (and D)
- Make an I-V curve of the diode using your measurements.
Circuit Visualization: Oscilloscope
-
Replace the DC supply with a sine wave from -10 to
+10 V (or as close as you can get to that) at a frequency of
1 kHz.
Observe the diode voltage with the oscilloscope.
- Sketch the voltage across the diode for at least
two cycles of the sine wave.
- Summarize the operation of the diode, given what you
know about diodes.
Explain your results to the lab
instructor before continuing.
Circuit simulation: Introducing DC Sweep
-
If using LTspice:
SPICE can do many different types of
circuit analysis.
Use the information in our
LTspice tutorial
to do a DC sweep.
The actual diode you'll be using isn't included in the
LTspice libraries, so you'll have to
use the information on
adding a model
in LTspice
to add a
model to the SPICE library.
(There are three different methods shown; use whichever one
works.)
Method 3 may be the easiest.
You can find a SPICE model at
ON Semiconductor. (Search for the part number and then
look for information about models.)
If using CircuitLab:
If you have another diode in the 1N400x family, where x is a digit, you can use it
but you'll need to find out what the difference is between the members of
the 1N400x family, and whether that should affect what you need to do in this lab.
If using LTspice or CircuitLab:
Do a DC sweep, and
from the DC sweep, plot the diode current versus the diode
voltage to compare with the graph above.
- Do a transient (or time domain) analysis to produce a graph of
voltage across
the diode versus time to compare with the sketch and the DC
sweep from above.
Comparing measured and simulated values
- Compare the values from the actual circuit to the
values from
your analysis and measurements above.
Show your results to the lab instructor.
- Save your circuit and your LTspice files (or CircuitLab
project) for future
use.
Before you leave the lab, have the lab instructor
sign your lab notebook immediately after your last entry.


