Read the section on lab notebooks on this web site. Record all data for this lab in your lab notebook.
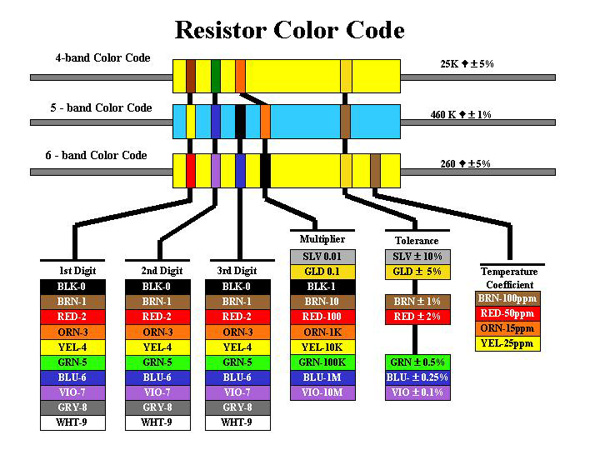
Read the section on fixed resistors on this web site. The following charts may also be of use; they all contain the same information but in slightly different formats.
For each of the following sections, record resistor markings and required information in your lab notebook.
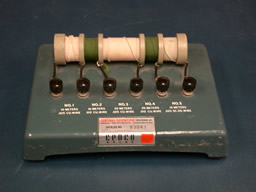
| The resistors to the right are higher power resistors. Since the resistors are physically large, the nominal value, tolerance, and wattage are written on the resistor. Complete the table. | 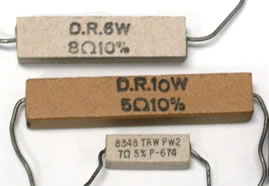 |
|||
| nominal value | tolerance | wattage | ||
|
top resistor
|
8 Ω | ±10% | 6 Watts | |
|
middle resistor
|
||||
|
bottom resistor
|
8348 = part number |
|||
 [click image to get a larger image] |
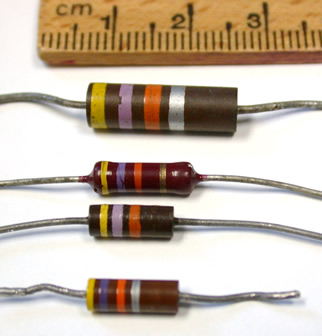
The resistors to the left are carbon composition (3)
and carbon film (1). Which one is the carbon film?
How did you determine that? [Note: carbon composition
resistors are obsolete.] |
|||
| nominal value | tolerance | expected range | ||
| top resistor | ||||
| middle top | ||||
| middle bottom | ||||
| bottom resistor | 47 kΩ | ± 10% | 42.3 kΩ - 51.7 kΩ | |
On the bottom resistor, it is difficult to tell if the second band is blue or violet. I have assumed that the band is violet because yellow-blue-orange is not a valid combination for a resistor with a ± 10% tolerance. Why are some colour combinations not valid?
|
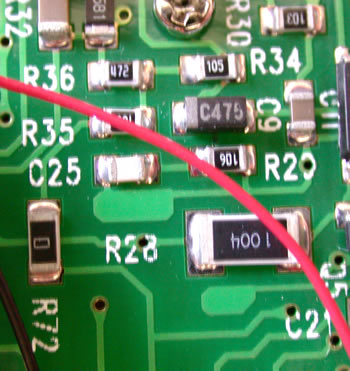
For the image to the right, list as many resistor values as you can. Write down:
R72 doesn't follow the normal 3 or 4 digit numbering convention. What is R72 and why is it used? |
|
|
|
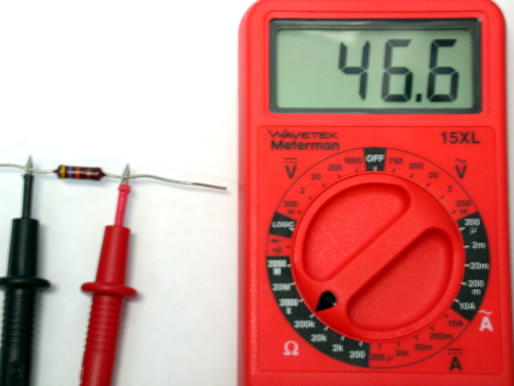
For the example shown to the left, the resistor is yellow-violet-orange-gold which corresponds to the nominal value 47,000 ± 5%. The expected resistance range is calculated to be 44.65 kΩ to 49.35 kΩ. A measurement range of 200K is selected because the nominal value of 47 kΩ is between 20KΩ and 200KΩ. Measuring the resistance shows 46.6 on the display with the measurement range at 200K which means the actual resistance is 46.6 kΩ. |
For each of the six resistors provided for this lab:
|
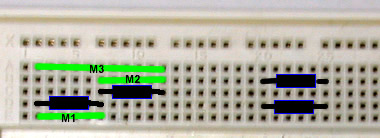
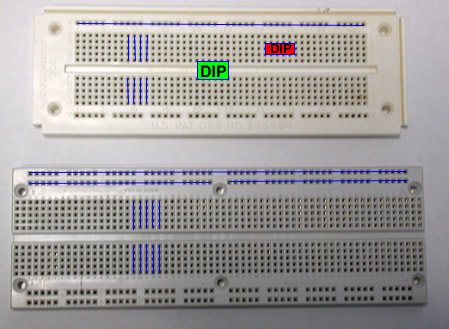
The image to the right shows two
single strip boards. The board at the top is our standard
board, labeled Experimentor™ 300, but the department
has various other single strip and multistrip boards
(multiple single strips side by side). A single strip board
has a trough down the centre of the board. Any dual inline
pin (DIP) chip, a chip with legs on both sides of the chip,
would be installed straddling the trough; the green
rectangle indicates proper placement, the red rectangle
indicates improper placement. Discrete components that are
not in a chip format, such as a resistor, do not have to
straddle the trough. On either side of the trough, there is an array of sockets. The sockets contain spring clips to make contact with any component lead inserted in the socket. The vertical groups of five sockets are electrically connected (shown by the blue vertical lines in the image). If you flip our standard board over, you can see the electrical connections through the paper. Do NOT remove the paper. |
|
At the top and bottom of the boards in the image are an
additional one or two rows of sockets. These rows are referred
to as the bus lines. The sockets in the bus lines are
partitioned into one or more electrically connected segments.
For example on the lower board in the image, the blue
horizontal lines indicate two possible electrical connection
options.
Verify the electrical connections of the two sample breadboards
using the
audible
continuity tester mode on the digital multimeter. An
audible continuity tester is used to identify electrical
connections or shorts, where the electrical connection
is interpreted as a 'wire'. Sketch the electrical
connections for both boards.
|
The diagram to the right shows both the schematic diagram and one wiring possibility for two resistors in series and parallel. Using two resistors with resistances of similar orders
of magnitude, construct the series circuit. When fitting
resistors into a circuit, do not bend the leads right at
the edge of the resistor body as this is the weakest
point of the component. If doing a tight fit to the board
for a project, use one of the two bending techniques
illustrated to the right. For the labs, tight board fit
is not required. Construct the parallel circuit and do the measures comparable to M1, M2, and M3. What did you learn? |
|
|
Rseries = R1 + R2 Rparallel = (R1 x R2)
/ (R1 + R2) |


![]()
Wilfrid Laurier University
© 2019 Wilfrid Laurier University