Pages created and updated by
Terry Sturtevant
Date Posted:
April 18, 2018
This lab will introduce you to some of the waveforms we will be using throughout the term. A Fast Fourier Transform (FFT) module will be used to analyze the harmonic content of three familiar waveforms.
"Sinusoidal waves can be used as simple building blocks to 'make up' and describe nearly any periodic waveform including square waves, [triangle waves] or even the irregular sound waves made by human speech. The process is named Fourier analysis... It is frequently used in signal processing and the statistical analysis of time series." - Wikipedia
Normally, when a signal is measured with an oscilloscope it is viewed in the time domain - that is, the vertical axis is voltage and the horizontal axis is time. For many signals this is the most logical and intuitive way to view them. However, when the frequency content of the signal is of interest, it makes sense to view it in the frequency domain. In this case, the horizontal axis becomes the frequency. Using the Fourier theory, one can mathematically relate the time domain with the frequency domain. The Fourier transform is given by:
where v(t) is a voltage signal represented in the time domain and V(f) is its Fourier transform in the frequency domain.
The discrete version of the Fourier transform shown in the above equation is called the Discrete Fourier Transform (DFT). The Fast Fourier Transform (FFT) is a computationally efficient algorithm for computing the DFT. It takes digitized time domain data and computes the frequency domain representation.
Put the oscilloscope in time domain mode.
Setup the function generator and oscilloscope so that
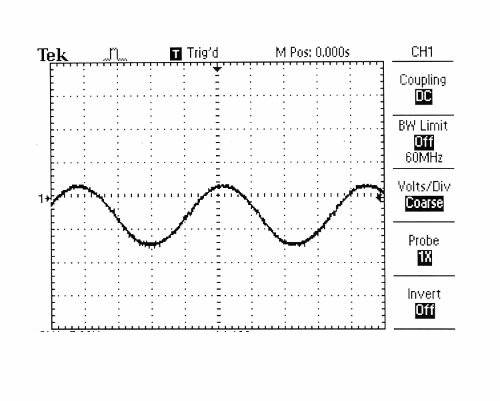
you see a 10 kHz sinusoidal
waveform with a peak to peak voltage of 3.5V.
You should see something like this:
The TDS1002 scope has built in functions to measure certain criteria of the incoming waveform. There is a group of six buttons near the top right corner of the screen. The button at the top in the center is labeled "Measure". Once in the measure menu, select the channel of the incoming waveform and scroll through the list to find the appropriate measurement. The TDS1002 can display five different measurements at once along the right side of the screen.
Wave Harmonics: "The harmonic of a wave is a component frequency of the signal that is an integer multiple of the fundamental frequency. For example, if the fundamental frequency is f, the harmonics have frequencies f, 2f, 3f, 4f, etc. The harmonics have the property that they are all periodic at the fundamental frequency, therefore the sum of harmonics is also periodic at that frequency. Harmonic frequencies are equally spaced by the width of the fundamental frequency and can be found by repeatedly adding that frequency. For example, if the fundamental frequency is 25 Hz, the frequencies of the harmonics are: 25 Hz, 50 Hz, 75 Hz, 100 Hz, etc." - Wikipedia
To view the harmonics of the wave change the display of the scope to the frequency domain (press the math menu button).
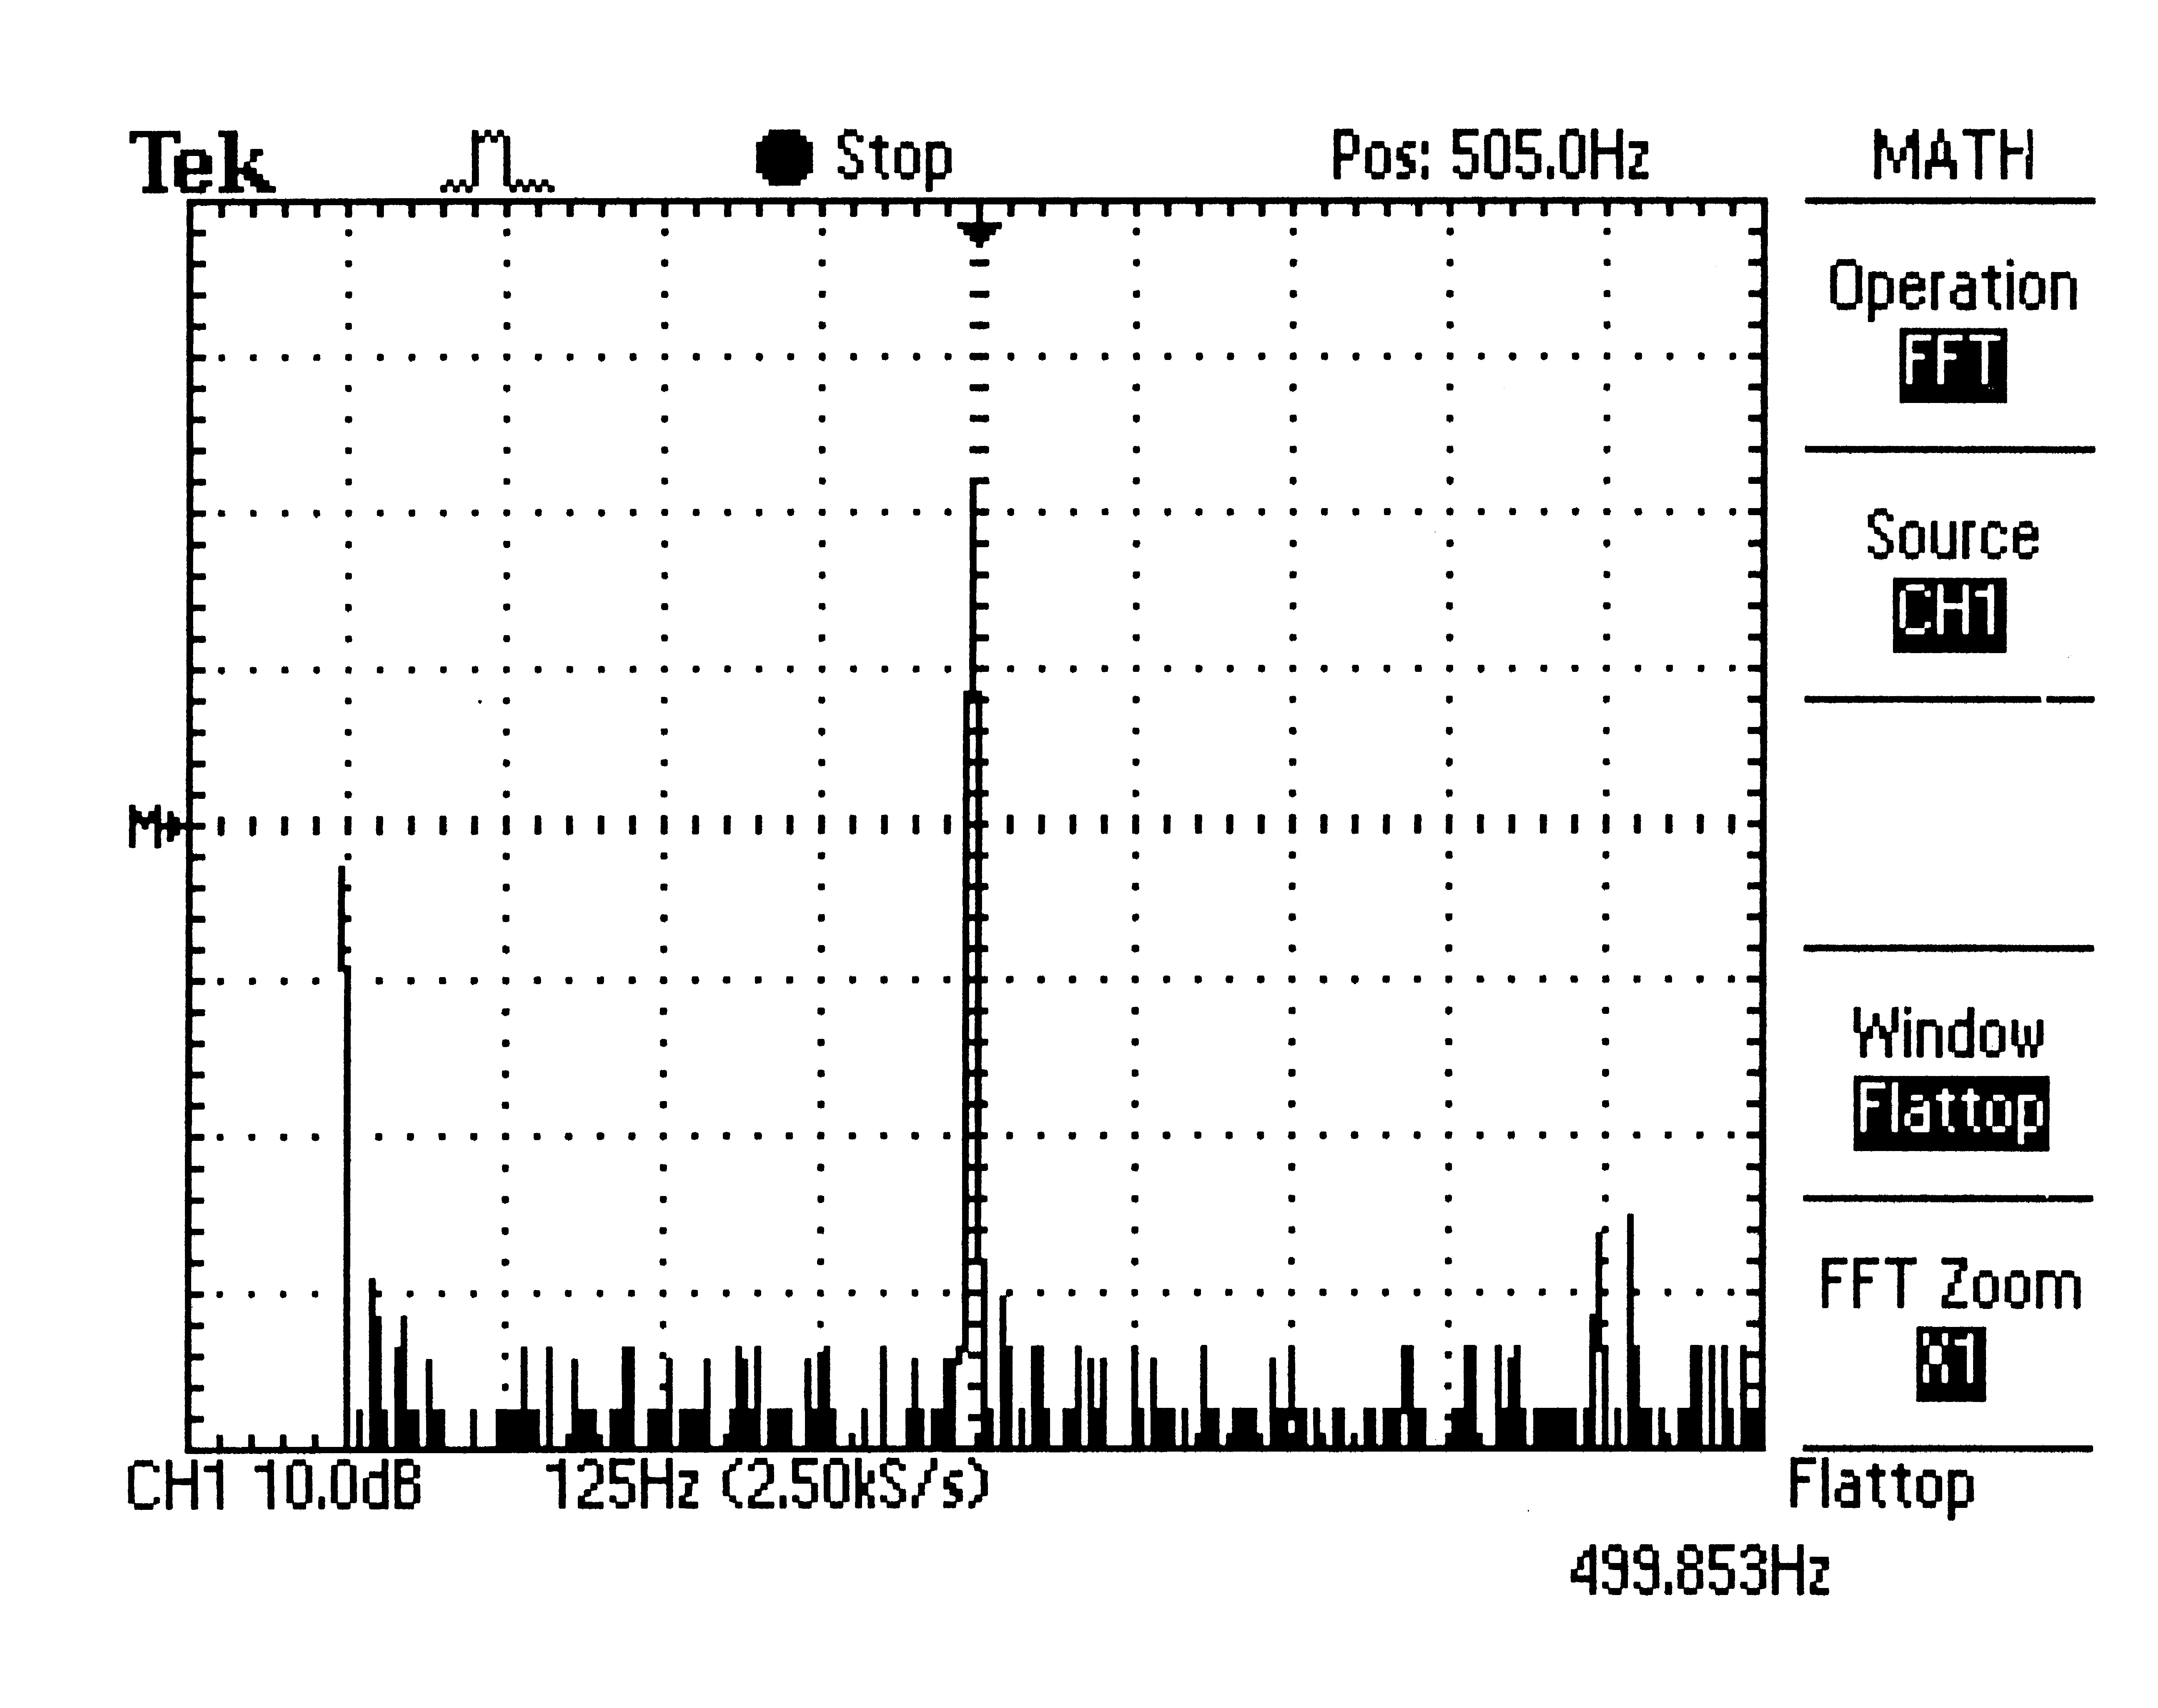
In FFT mode, the signal should look something like this:
Voltages are sometimes expressed in decibels.
In this case, for the oscilloscope it says that 0dB=1VRMS so
Vdb = 10 log10V (V)
To convert back from dB to V, it should be obvious that
V (V) = 10VdB/10
The advantage to using decibels is that a ratio of voltages
becomes just a difference in decibels.
A square wave is a type of non-sinusoidal waveform. These are mostly used in digital electronics and signal processing. Ideal square waves alternate between two levels (0 and 1) instantaneously and regularly. The duty cycle (ratio of high period compared to total period) should be exactly 50%. The square wave only contains odd integer harmonics. The frequency of a square wave is obtained by measuring the length of time between the middle of the rising edge from one pulse to the next (or the middle of the falling edge from one pulse to the next).
Your screen should look something like this:
A triangle wave is a non-sinusoidal waveform named, obviously, for its shape. The triangle wave also contains only odd harmonics. The sound of the triangle wave is smoother than a square wave and is nearer to that of a sine wave. The frequency of a triangle wave is obtained by measuring the length of time between the middle of the rising slope of one pulse to the middle of the rising slope of the next pulse (or point to point).
Question: In theory, the sinusoidal wave has no harmonics, and the square and triangle wave have only odd harmonics. Can you see this in your printout?
Demonstrate and explain your results to the lab instructor.
The FFT function in the TDS1002 scope uses 2048 time-domain data
points and produces a frequency-domain display with 1024 points.
The display extends in frequency from fmin to
feff/2, where feff is the effective sampling
rate of the time record. The effective sampling rate feff
is the reciprocal of the time between two adjacent samples and depends on
the Sec/Div setting of the scope. For the TDS1002 scope,
feff is 2x the frequency at the right of the screen.
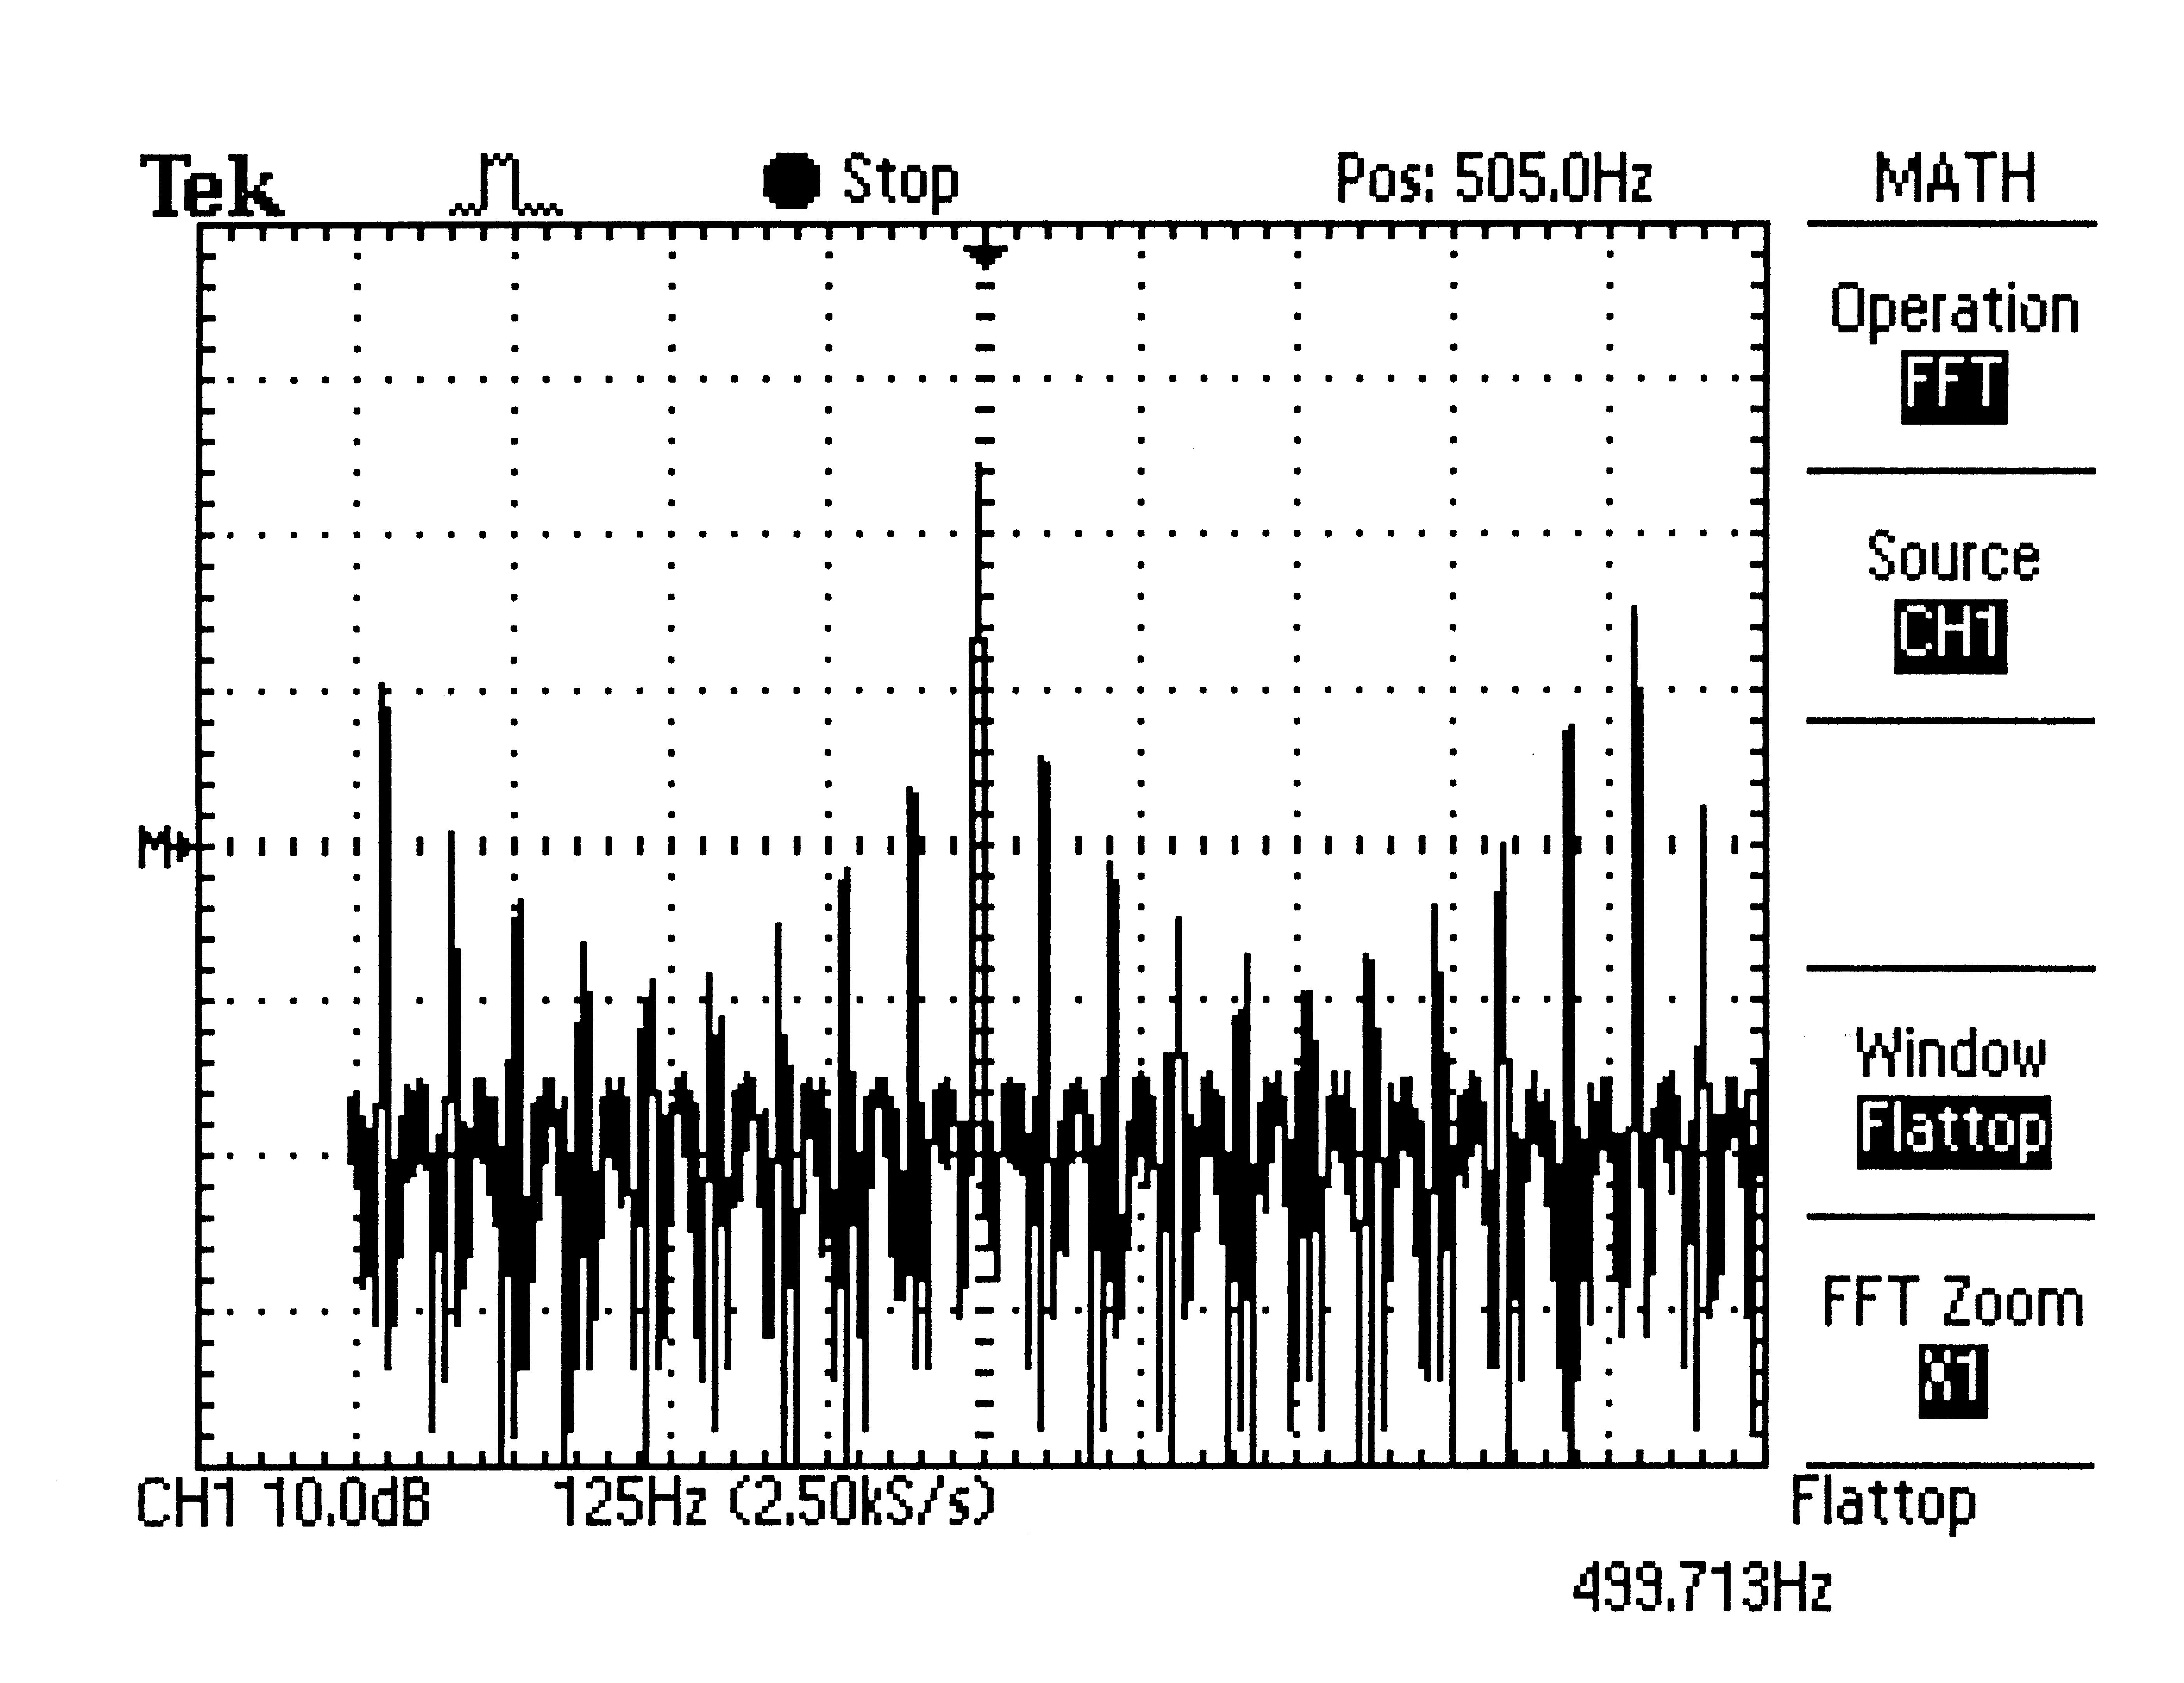
In the example above, where the scale is 125 Hz, then the right of
the screen is at 10 x 125 Hz=1.25 kHz, so
feff is 2x 1.25 kHz = 2.50 kHz.
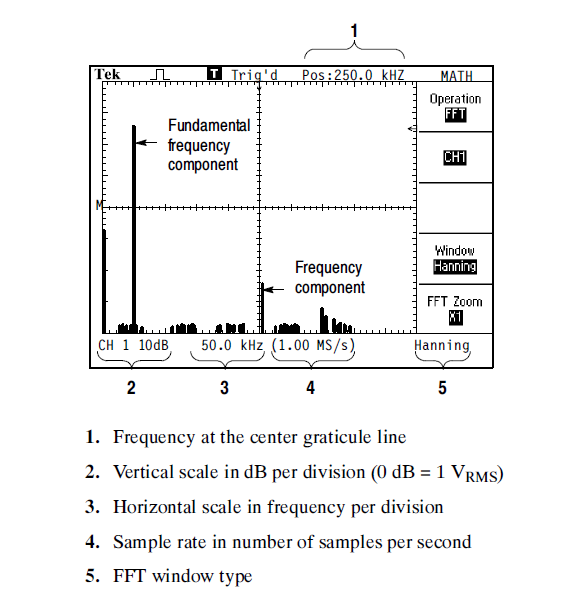
Here's what it looks like on the screen:
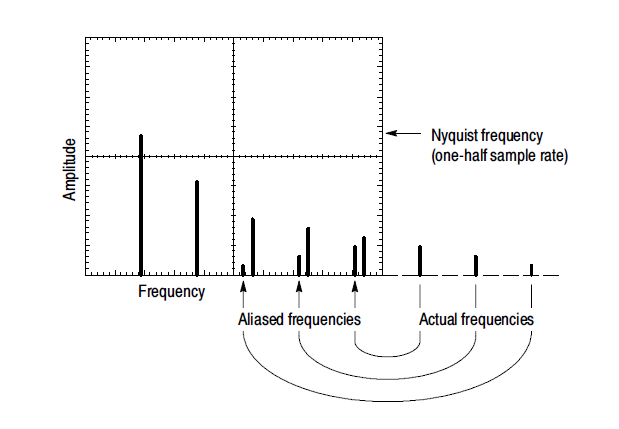
The upper frequency feff/2 for the FFT spectrum is also called the folding frequency. Frequencies that would normally appear above feff/2 (and hence outside the useful range of the FFT) are folded back into the frequency domain of the display. These unwanted frequency components are called aliases, since the erroneously appear under the alias of another frequency. Aliasing is avoided if the effective sampling rate is greater than twice the bandwidth of the signal being measured.
Switch back to the sinusoidal waveform on the frequency generator (still at 10 kHz) and adjust the FFT menu settings so that you get a peak in the central region of the FFT display. Use the Sec/Div control to set the sampling rate to 50 kSa/s.


![]()
Wilfrid Laurier University
© 2019 Wilfrid Laurier University