PC221 Analog Electronics I
Simple AC Circuits
Objectives
- To introduce analysis of simple AC circuits.
- To review the use of the function generator.
- To introduce measurement of simple AC circuits.
- To expand the use of SPICE circuit simulation to
include transient analysis and the use of
cursors.
- To compare results of analysis, measurement, and simulation.
Equipment
- digital multimeter, bench power, oscilloscope
- various resistors
Background
Analyzing circuits with both DC and AC components is slightly
more complicated than analyzing DC circuits.
To analyze a circuit like this, you need to use the principle of
superposition. In other words, you can look at the DC and
AC components of the signal in the circuit separately, and then
simply add the results.
(Important note: Superposition works for voltage and
current but not power, since power is non-linear
in either current or voltage.)
Determining DC and AC components using
Kirchhoff's Laws
Here's how to do it:
- For the DC analysis,
- replace all AC sources with no DC offset
with a wire.
- replace all AC sources with non-zero DC offset
with a DC voltage of the offset.
- For the AC analysis,
- replace all DC sources
with a wire.
- replace all AC sources
with an AC voltage of the amplitude.
Measuring DC and AC components using
an oscilloscope
When using the oscilloscope to measure, you can follow a similar
process.
- For the DC analysis:
- Set the coupling for each channel to DC.
- When measuring an AC voltage, only measure its
midpoint; not the top or bottom.
- For the AC analysis:
- With the coupling for each channel to DC,
measure the amplitude of any waveform. Ignore its
DC offset.
- Alternatively, for the AC analysis:
- Set the coupling for each channel to AC.
- Measure the amplitude of any waveform.
Recall what the limitations are on measuring voltages using AC
coupling. Only use AC coupling if you can't get the AC portion
of the signal on the screen at a size that is big enough to
measure. Use DC coupling if possible.
Measuring DC and AC components using
a digital meter
When using the digital meter to measure, you can
follow a similar process.
- For the DC analysis:
- Set the scale to measure DC voltages.
- For the AC analysis:
- Set the scale to measure AC voltages.
Remember to pay attention to whether the digital meter
gives amplitude, peak-to-peak, or RMS values for readings.
Determining DC and AC components using
SPICE
Doing a SPICE simulation involves two steps as well.
Note that you only have to draw
the circuit once; you will use different types of analysis to
get the DC and AC results. It goes like this:
- For the DC information:
- Do a DC operating point analysis, as before.
- For the AC information:
-
Do a transient analysis analysis
which will show
voltages and currents over time,
just like the oscilloscope.
LTspice Instructions
In LTspice, to see the signals over time
use a transient analysis.
CircuitLab Instructions
In CircuitLab, to see the signals over time
use a time domain analysis.
Hint: To do math with signals, like on a scope, you can use
"Add expression" to add, subtract, etc.
Procedure
Setup
- You'll be modifying the circuit from last week, replacing the
DC source for
V1 with a 1V 1kHz AC sine wave source with a DC offset
of
5V, like this:
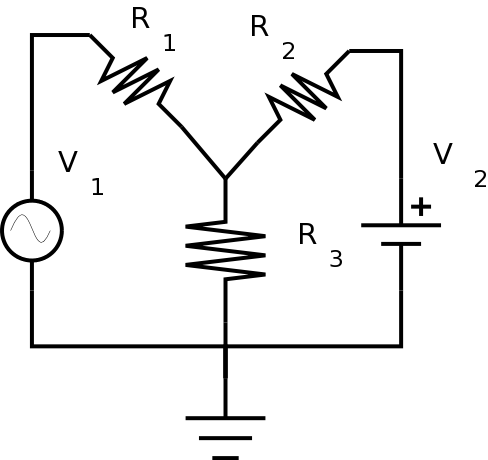
Leave the other values as before; i.e.
- V2 = 12V
- R1 = 2.7 kΩ
- R2 = 4.3 kΩ
- R3 = 1.2 kΩ
-
Measure the resistor values and the DC supply
voltage
using the digital
multimeter and
enter them in the Table 1a:
| Table 1a: Component Values |
| Quantity |
Measured Value |
Units |
| R1 |
|
|
| R2 |
|
|
| R3 |
|
|
| V2 |
|
|
- Connect the function generator to the oscilloscope.
Make sure the scope channel is in DC mode for
this.
Adjust the wave generator to produce a 1V 1kHz sine wave, with a
DC offset of 5V.
- Connect the circuit as shown.
Use the oscilloscope to see that the output of the wave
generator does not change significantly when the circuit is
connected.
When using a wave generator, always check the
output with a scope before connecting it to a circuit.
Then when you connect it to the circuit, if it changes
drastically, there is probably something wrong so you can
disconnect it and examine the circuit.
Put the measured values for
V1 using the oscilloscope into Table 1b:
| Table 1b: Component Value |
| Frequency (from wave generator) |
Units |
| F |
|
|
| Quantity |
Amplitude |
Offset |
Units |
| V1 |
|
|
|
Circuit Measurements: Oscilloscope
- Measure each of the
voltages using the oscilloscope.
(Note: If you're ever adding or subtracting on the
oscilloscope, make sure that the coupling and the scale are the
same for both channels.)
Sketch the waveform for each of the voltages you measure.
Indicate both the amplitude and offset of each voltage in the
sketch.
Fill in the values in the tables.
| Table 2: DC Values |
| Quantity |
Oscilloscope |
Digital Meter |
Simulation |
Analysis |
Units |
| VR1 |
|
|
|
|
|
| VR2 |
|
|
|
|
|
| VR3 |
|
|
|
|
|
| Isupply1 |
|
|
|
|
|
| Isupply2 |
|
|
|
|
|
| IR1 |
|
|
|
|
|
| IR2 |
|
|
|
|
|
| IR3 |
|
|
|
|
|
| Table 3: AC Values |
| Quantity |
Oscilloscope |
Digital Meter |
Simulation |
Analysis |
Units |
| VR1 |
|
|
|
|
|
| VR2 |
|
|
|
|
|
| VR3 |
|
|
|
|
|
| Isupply1 |
|
|
|
|
|
| Isupply2 |
|
|
|
|
|
| IR1 |
|
|
|
|
|
| IR2 |
|
|
|
|
|
| IR3 |
|
|
|
|
|
| Frequency |
|
|
|
|
|
- Using the measured voltages, calculate each of the
currents.
Fill in the values in the tables.
- Measure the period of the waveform, and calculate the
frequency. Add it to the table.
Show your results to the lab instructor.
Circuit Measurements: Digital Meter
- Now measure each of the
quantities using the digital multimeter.
Note that the multimeter has both AC and DC scales. You'll need to
use both scales to measure the voltages to see the AC and DC
components of the voltages.
If the digital meter gives RMS
measurements, then add a column to the table to show the values
converted to amplitude, so they can be compared directly to the
other
values.(This applies to the current calculations as well.)
- Using the voltages measured using the digital multimeter,
calculate each of the
currents.
- Measure the frequency of the waveform.
Show your results to the lab instructor.
Circuit Simulation: Introducing transient
analysis
Like last week, you only need to use one of the
simulators;
either LTspice or Circuitlab, not both.
SPICE can do many different types of
circuit analysis.
LTspice Instructions
-
Do an operating point analysis, using the measured component
values like last week.
Use the information in the tutorial to do a
transient analysis. You can also look at
pages 8 to 10 of
Intro to LTspice .
This will show the signals over time, much
like what you would see on an oscilloscope.
How to use cursors:
See the information on page 53 of the
LTspice manual
to learn how to use cursors.
If you use the same scales on your sketch
and on your LTspice trace, it will make it much easier to see how
they compare.
Show your results to the lab instructor.
- Save your LTspice files for future use.
CircuitLab Instructions
-
Do a DC analysis, using the measured component
values like last week.
Do a time domain analysis.
This will show the signals over time, much
like what you would see on an oscilloscope.
Hint: To do math with signals, like on a scope, you can use
"Add
expression" to add, subtract, etc.
If you use the same scales on your sketch
and on your CircuitLab trace, it will make it much easier to see
how
they compare.
Show your results to the lab instructor.
- Save your CircuitLab circuit for future use.
Analysis: Kirchhoff's Laws
You can complete the rest of this
after
you have left the lab. If your results so far are consistent,
doing the analysis should be straightforward.
- Redraw the circuit in both ways (for DC and AC
analysis), and analyze them using Kirchhoff's laws, as explained
above.
(Use the measured component
values like last week.)
(Hint:One of the drawings should look very familiar.)
Remember that for the AC analysis, the resulting voltages and
currents will be AC quantities.
Show your two drawings and your results to the lab
instructor before continuing.
- Perform the DC analysis and fill in the appropriate column of
Table 2.
Calculate the DC voltage at the top of
R3,
the DC currents from each supply, and the DC currents through each
resistor.
- Perform the AC analysis and fill in the appropriate column of
Table 3.
Calculate the AC voltage at the top of
R3,
the AC currents from each supply, and the AC currents through each
resistor.
Show your results to the lab instructor.
Comparing Results
- Compare the values from the actual circuit to the values from
your analysis and measurements above.
The important thing is to
rationalize your different results. In other words, if
any
two quantities differ by more than 20% or so, you should recheck
your various values because there is probably a mistake somewhere.
For AC values, make sure to state all values using the same
terminology; ie. amplitude, peak-to-peak, or RMS. You may have to
convert some in this case.
Show your results to the lab instructor.
- Save your circuit for future use.
Before you leave the lab, have the lab instructor
sign your lab notebook immediately after your last entry.


